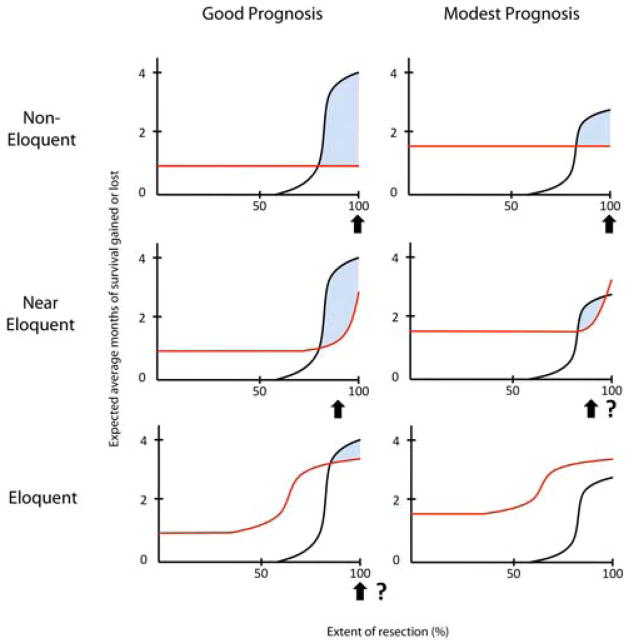
Figure 1.
Conceptual framework for the relationship between risk and benefit for cytoreductive glioblastoma surgery according to tumor resectability and preoperative prognosis. Black curves indicate expected average months of survival gained from tumor cytoreduction if the extent of resection (EOR) threshold is assumed to be approximately 80%. Red curves indicate expected average months of survival lost due to general perioperative complications and surgically acquired neurological deficits. Shaded area indicates the range of EOR within which a net survival benefit exists. Arrows indicate EOR at which benefit is maximal for each scenario. Question marks indicate scenarios where projected net benefit may not be clinically meaningful.

