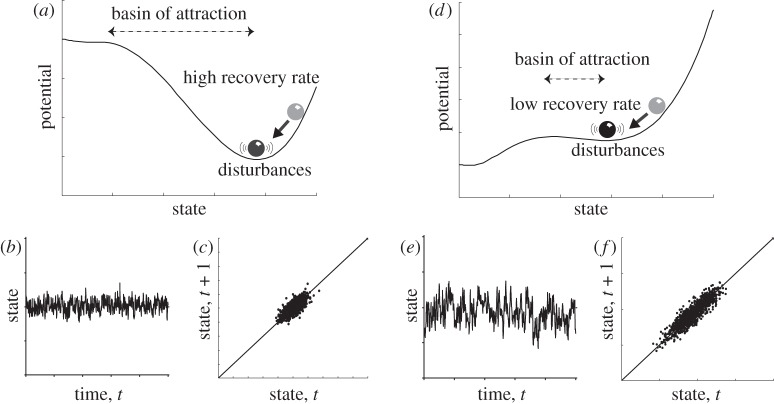
Figure 1.
Heuristic illustration of critical slowing down. Panels show characteristic changes in non-equilibrium dynamics as a system approaches a tipping point (catastrophic bifurcation). (a–c) Far from the tipping point (a), the basin of attraction is steep and the rate of recovery from perturbations is relatively high, such that if the system is stochastically forced (b), the resulting dynamics are characterized by (c) low correlation between the states at subsequent time intervals and low variance. (d–f) When the system is closer to the tipping point (d), the basin of attraction shallows and the rate of recovery from small perturbations is lower, such that if the system is stochastically forced (e), the resulting dynamics are characterized by (f) a stronger correlation between subsequent states and a larger variance. (Adapted from Scheffer et al. [4].)

