
Figure 2.
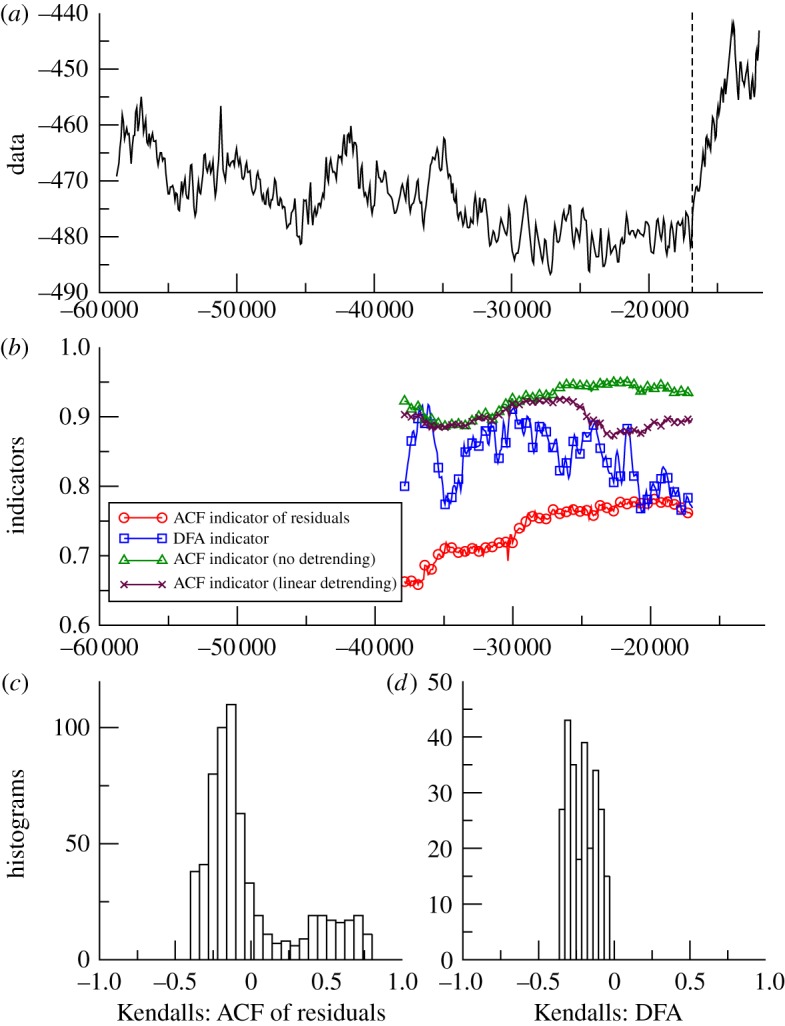
Search for early warning of the last deglaciation as seen in Antarctica. (a) Vostok deuterium proxy for local temperature 58.8–17 kyr BP (n=513). Analysis stops at the vertical dashed line before the termination occurs. (b) Example of early warning indicators from autocorrelation function (ACF) with various detrending methods, or detrended fluctuation analysis (DFA); results plotted at the end of the windows (sliding window length of half the data series in all cases, bandwidth = 25 for ACF method). (c) Histogram of the frequency distribution of the Kendall trend statistic for the ACF of residuals indicator, when varying the sliding window length and filtering bandwidth. (d) Histogram of the frequency distribution of the Kendall trend statistic for the DFA indicator, when varying the sliding window length. (Online version in colour.)