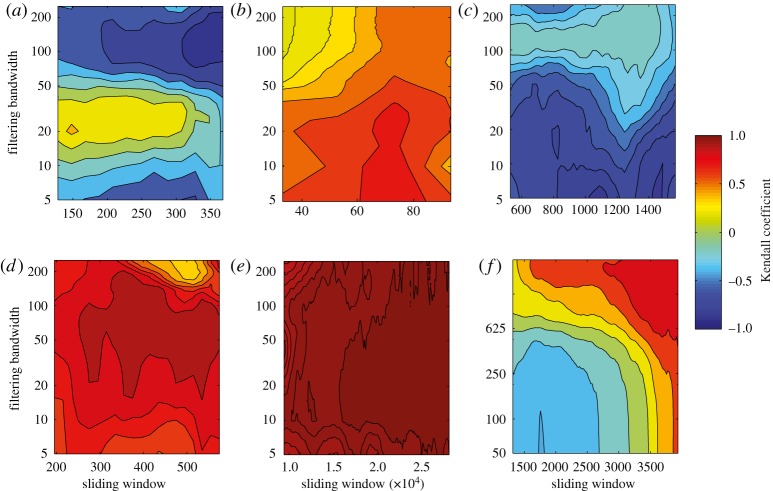
Figure 9.
Trends in variance as a threshold is approached for all the datasets. Contour plots show the value of the Kendall trend statistic for the trend in standard deviation, derived after detrending by Gaussian filtering across the whole series, when varying the sliding window length and filtering bandwidth. For different datasets: (a) Vostok, (b) GISP2, (c) Cariaco, (d) CLIMBER-2, (e) GENIE-1, (f) GENIE-2 (raw data).

