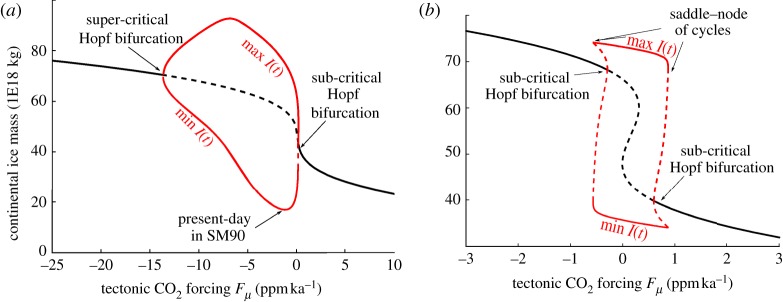
Figure 3.

Bifurcation diagrams of the Saltzman and Maasch models (a) SM90 and (b) SM91 as a function of Fμ, here treated as a constant control parameter. Note the difference in scales on both axes. Black lines are fixed points. Continental ice mass (I) is shown as a function of tectonic forcing Fμ. The lines denoted ‘max’ and ‘min’ indicate the boundaries of the limit cycles. Unstable fixed points or limit cycles are denoted by dashed lines. Calculations and figures were made using the pseudo-arc-length continuation software package AUTO [50]. (Online version in colour.)
