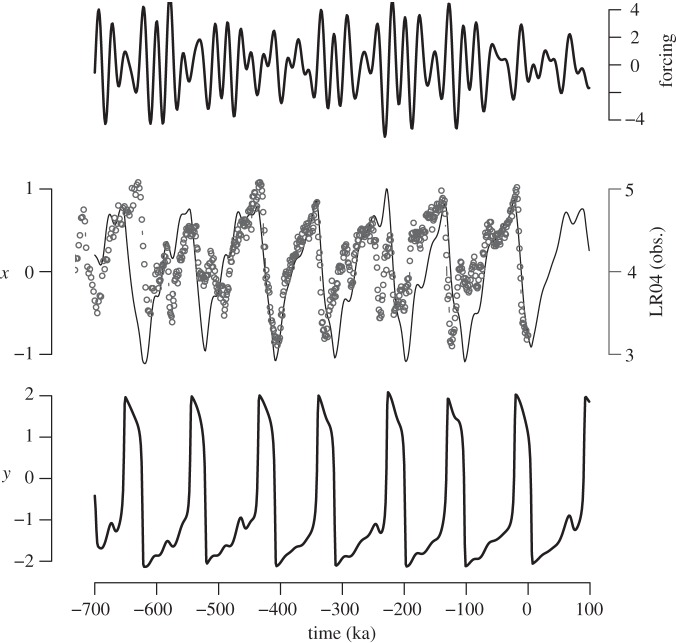
Figure 7.
Astronomical forcing, x and y trajectories obtained using system (van der Pol, VDP) with α=30, β=0.75, γ=0.4 and τ=36 ka (1 ka=1000 years). Black dots are an authoritative natural archive thought to mainly represent fluctuations in ice volume and deep-ocean temperature, and compiled in Lisiecki & Raymo [9].

