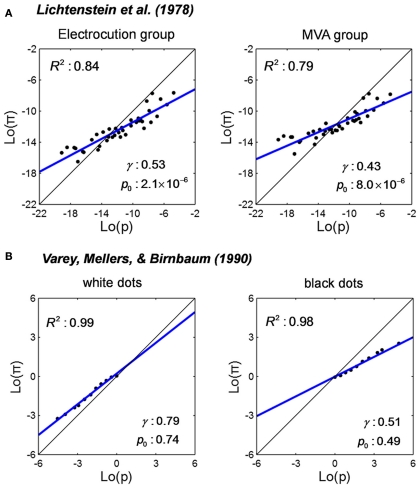
Figure 4.
Linear in log odds fits: frequency estimates from memory or perception. Estimated relative frequency is plotted against true relative frequency on log odds scales and fitted by the LLO function. Black dots denote data. The blue line denotes the LLO fit. R2 denotes the proportion of variance accounted by the fit. (A) Estimated frequency of lethal events from Lichtenstein et al. (1978). Participants were asked to estimate the number of occurrences of different causes of death per year in the US. The actual frequency of one cause was provided as a reference for participants to estimate the frequencies of the other causes. The relative estimated and actual frequencies in the plot were the frequencies divided by the then US population. Left: when the frequency of Electrocution (1000) was given as reference. Right: when the frequency of MVA (motor vehicle accident, 50000) was given as reference. (B) Estimated frequency of visual stimuli from Varey et al. (1990). The task was to estimate the relative frequency of black or white dots among a visual array of black and white dots. The proportion of black dots was larger than the proportion of white dots. Two groups of participants respectively estimated the relative frequency of white dots (small p) and black dots (large p). Left: the white dots group (p ≤ 0.5) was estimated. Right: the black dots group (p ≥ 0.5) was estimated.

