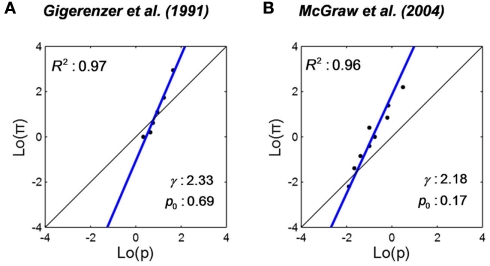
Figure 5.
Linear in log odds fits: confidence rating for cognitive and motor responses. Estimated probability of being correct or successful is plotted versus the actual probability on log odds scales and fitted by the LLO function. Black dots denote data. The blue line denotes the LLO fit. R2 denotes the proportion of variance accounted by the fit. (A) Estimated probability of being correct in general-knowledge questions from Gigerenzer et al. (1991). Participants first chose an answer for two alternative general-knowledge questions and then indicated the probability that the answer was correct. (B) Estimated probability of success in basketball shooting from McGraw et al. (2004). Participants rated their probability of success before each basketball shot.

