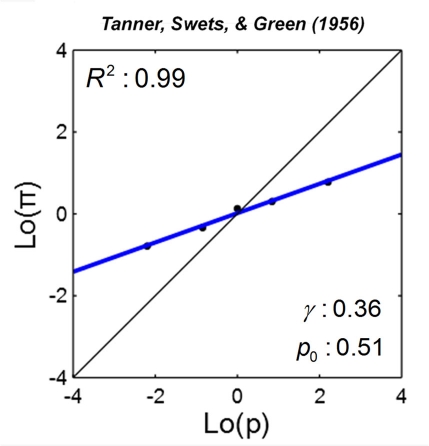
Figure 7.
Linear in log odds fit: signal detection theory. Estimated probability of signal present is plotted against the true probability on log odds scales for one participant. Black dots denote data. The blue line denotes the LLO fit. R2 denotes the proportion of variance accounted by the fit. In Tanner et al. (1956), c.f. Green and Swets (1966/1974), participants were asked to report whether a sound signal was present or absent. Estimated probability was inferred from the participant’s decision criterion based on signal detection theory. Data are from Table 4-1 of Green and Swets (1966/1974).

