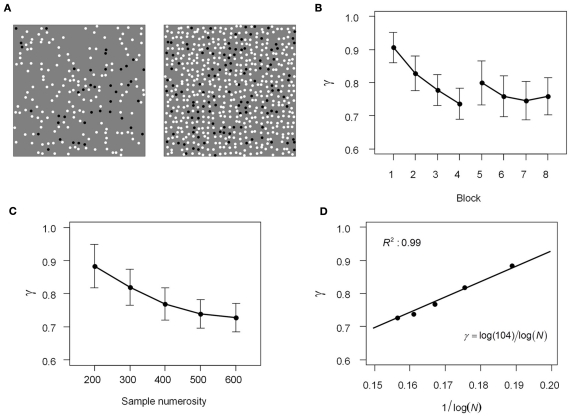
Figure 8.
Slope of distortion in relative frequency estimation. The methods and results of Experiment 1. (A) Examples of the relative frequency task: what proportion of the dots are black? The left display contains 200 dots in total, the right, 600. In both displays, 20% of the dots are black. (B) Effect of experience. The mean slope γ across 11 participants is plotted against block index, one to four for the first session, five to eight for the second session. Later blocks are supposed to be associated with more experience. More experience led to greater distortion (γ further from 1). Error bars denote SEs of the mean. (C) Effect of sample numerosity. The slope γ across 11 participants is plotted as a function of sample numerosity N (the total number of dots displayed in a trial). Larger sample numerosity resulted in greater distortion (γ further from 1). Error bars denote SEs of the mean. (D) The function of the mean γ to sample numerosity, N. Dots denote data. Solid line denotes the fit of γ as proportional to the reciprocal of log N.

