
Figure 4.
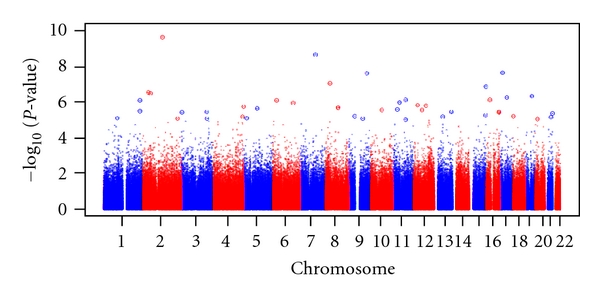
Overview of genome-wide association study of cockroach sensitization in the African American population. Manhattan plot showing the association of 644,709 SNPs by chromosome for cockroach allergy versus –log10P value. The x-axis represents genomic position, and the y-axis shows –log10(P).