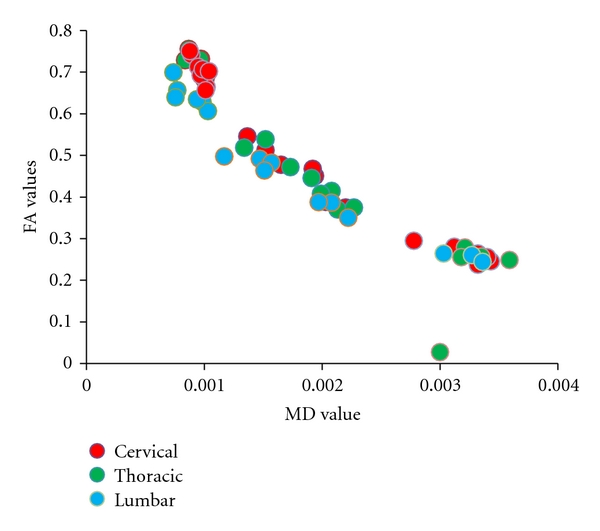
Figure 2.

Centroid coordinates for each region of the cord, for each person. Centroid coordinates, which reflect the mean FA and MD for each cluster, remained relatively consistent along the length of the cord, specifically in the white matter cluster.
