Figure 3.

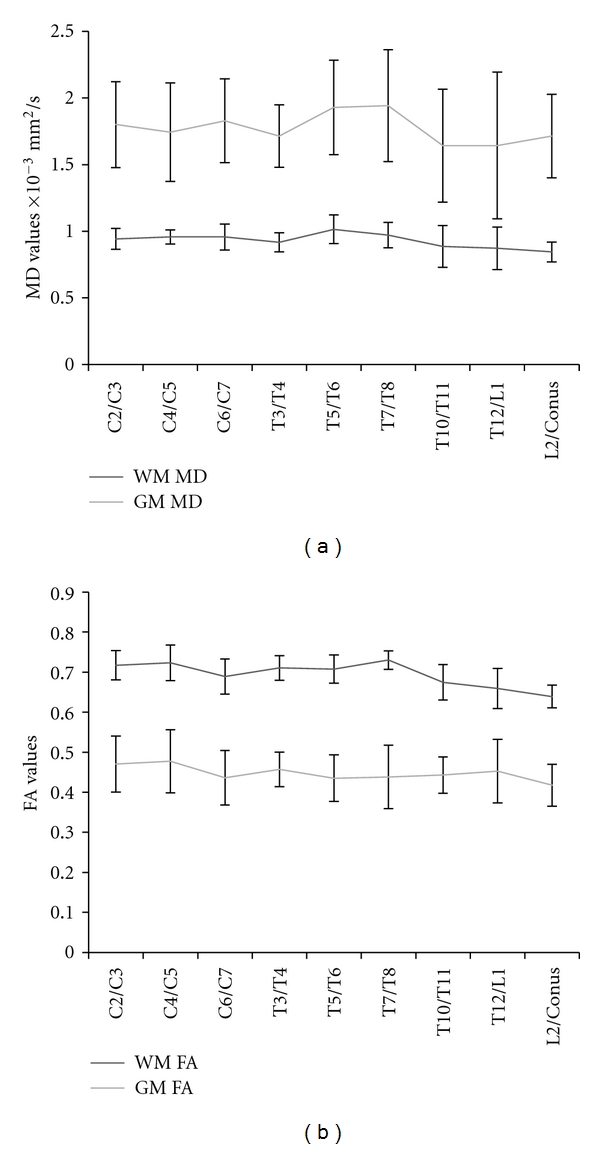
(a) MD values from the white matter and grey matter cluster averaged across subjects for each segment of the cord. (b) White matter and grey matter FA values averaged across subjects for each segment of the cord.

(a) MD values from the white matter and grey matter cluster averaged across subjects for each segment of the cord. (b) White matter and grey matter FA values averaged across subjects for each segment of the cord.