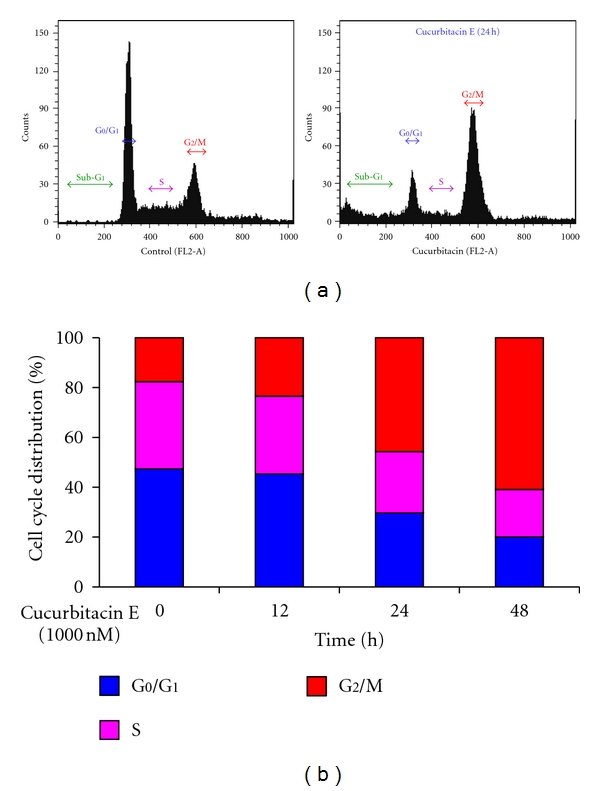
Figure 2.

The effects of cucurbitacin E on the G2/M phase arrest in T24 cells. Cells at a density of 2 × 10⁵ cells per well were placed in 12-well plates and then were treated with 1000 nM cucurbitacin E for different time periods (12, 24, or 48 h). Cells were harvested for evaluating the cell cycle distribution as described in the Materials and Methods. (a) The representative of profiles of DNA content; (b) the percentage of cells in G0/G1, S, and G2/M phase in T24 cells. Data revealed a representative experiment in triplicate with similar results.
