Figure 3.

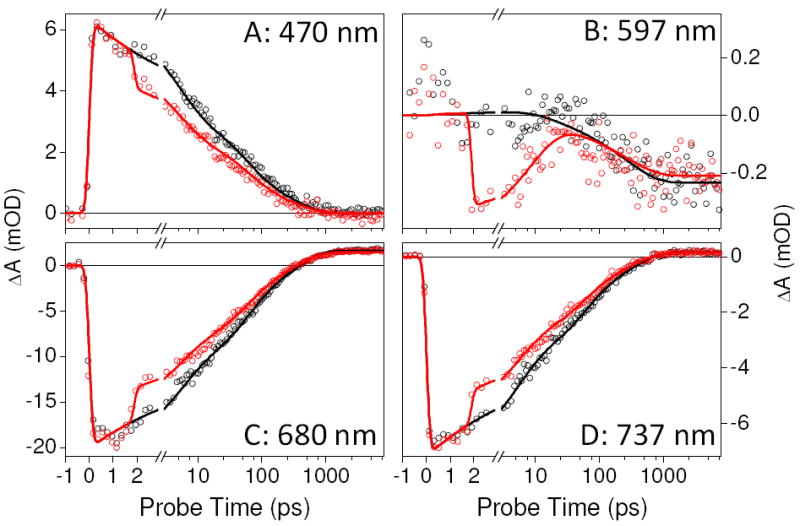
Select kinetic traces of PP (black circle) and PDP (red circle) at wavelengths indicated. Both PP and PDP data are fitted with a kinetic model (solid lines) described in the Supporting Information (Fig. S4).

Select kinetic traces of PP (black circle) and PDP (red circle) at wavelengths indicated. Both PP and PDP data are fitted with a kinetic model (solid lines) described in the Supporting Information (Fig. S4).