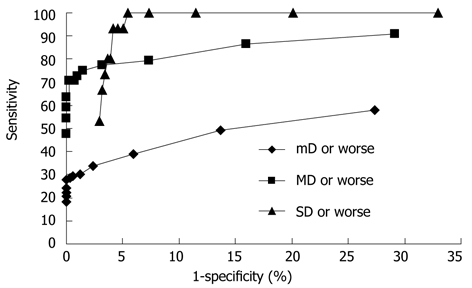
Figure 3.

Receiver operating characteristics curves of DNA image cytometry based on histopathological results including mD or worse, MD and worse or SD or worse. For each curve, the 15 points from right to left are from at least one aneuploid cell to at least 15 aneuploid cells. mD: Mild dysplasia; MD: Moderate dysplasia; SD: Severe dysplasia.
