Figure 7.
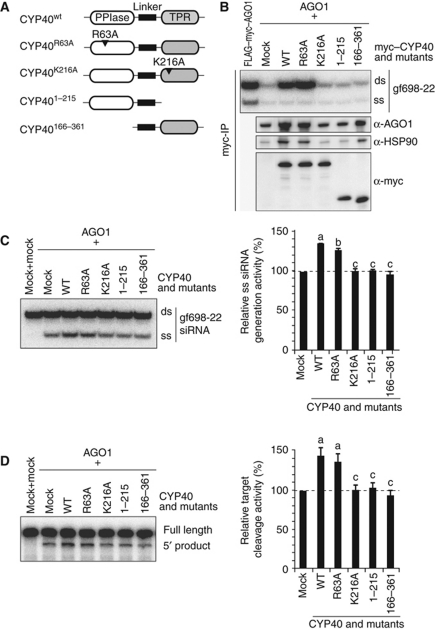
Effect of deletion and point mutations in CYP40 on RISC assembly. (A) CYP40 mutant proteins used in this study. (B) Copurification of HSP90, AGO1, and small RNA with CYP40 mutant proteins. AGO1 and myc–CYP40 mutant proteins were synthesized in BYL, mixed, and incubated with gf698-22 siRNA duplex containing 32P-labelled guide strand at 25°C for 30 min in the presence of additional 0.75 mM ATPγS and 1 mM MgCl2. The myc–CYP40 proteins were immunopurified with anti-myc antibodies and copurified RNA was analysed by 15% native PAGE. A similar experiment using unlabelled gf698-22 siRNA duplex was performed in parallel, and copurified proteins were analysed by immunoblotting using anti-myc, anti-HSP90, and anti-AGO1 antibodies. (C) Effect of the CYP40 mutant proteins on generation of ss small RNA. AGO1 and non-tagged CYP40 mutant proteins were synthesized in BYL, mixed, and incubated with gf698-22 siRNA duplex containing 32P-labelled guide strand at 25°C for 30 min. After the reaction, RNA was extracted and analysed by 15% native PAGE (left panel). The ss siRNA generation activity was calculated as described in the legend to Figure 3A. The graph shows the averages and s.d. of the relative ss siRNA generation activity values obtained in three independent experiments (right panel). Different letters indicate statistically significant differences (Student’s t-test, P<0.01). (D) Effect of the addition of the CYP40 mutant proteins on target cleavage activity. AGO1 and non-tagged CYP40 mutant proteins were synthesized in BYL, mixed, incubated with gf698-22 siRNA duplex at 25°C for 30 min, and further incubated with internally 32P-labelled GF-s target RNA at 25°C for 10 min. RNA was extracted from the mixtures and analysed by 5% denaturing PAGE (left panel). Relative target cleavage activity was calculated as described in the legend to Figure 3B. The graph shows the averages and s.d. of the relative target cleavage activity values obtained in four independent experiments (right panel). Different letters indicate statistically significant differences (Student’s t-test, P<0.01).

