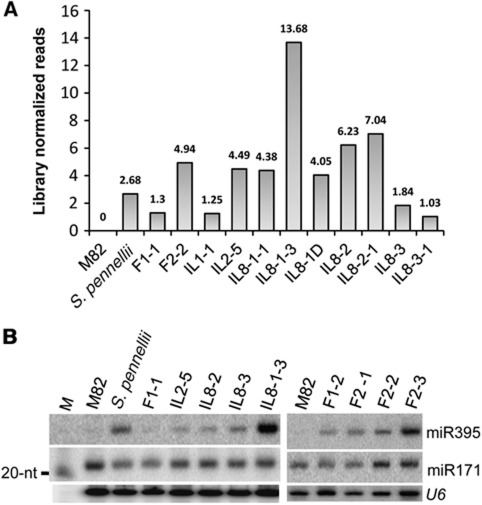
Figure 1.
Transgressive expression of miR395. (A) Bar chart showing the abundance of miR395, normalised to the sizes of the sRNA data sets. Relative abundance was calculated using miRprof (UEA sRNA tool kit (Moxon et al, 2008)). (B) Accumulation of miR395 in parents and selected ILs. About 15 μg of total RNA from young seedlings were used for analysis of each sample. Total RNA was electrophoresed in 15% polyacrylamide gel, transferred to membrane and probed with corresponding DNA oligonucleotides (Supplementary Table SI) labelled with γ-32P-ATP. U6 serves as loading control. M, Size marker.

