Figure 6.
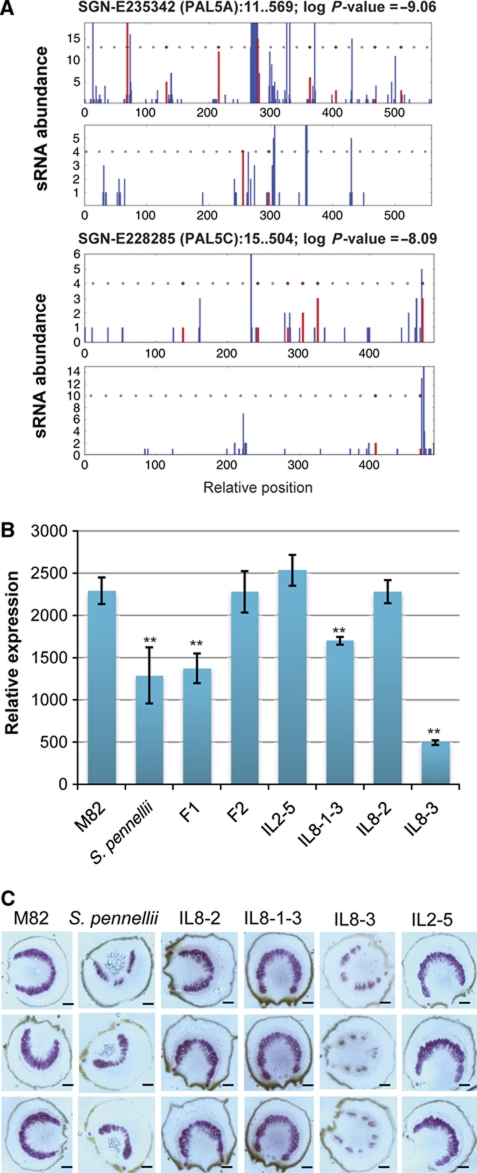
PAL silencing results in reduced lignification. (A) Phasing of PAL-derived siRNAs along the PAL sequences. Two PAL ESTs with significant P-values (PAL5A, log P value=−9.06; PAL5C, log P-value=−8.09) for phasing are shown. Red bars indicate the start position of sRNAs in phase; and blue, the start position for those out of phase. Rectangles indicate expected phased positions and those in red indicate phased sequences. (B) PAL mRNA expression of parental and hybrid lines. See Materials and methods section for details. Data are mean±s.d. of three biological replicates. The double asterisks represent significance determined by one-way ANOVA at P<0.01 (α=0.05). (C) Phloroglucinol staining for total lignin in parental lines, IL8-3 and three other ILs. Violet stain indicates the presence and distribution of lignin. The micrographs are of sections derived from petioles of seedlings with staining concentrated in the vascular bundles. Size bar, 100 μM.

