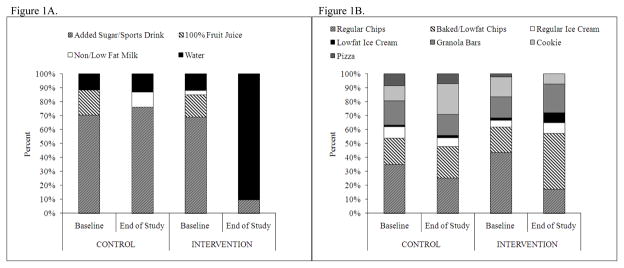
Figure 1.
Proportion (%) of types of beverages (1A) and snacks/desserts (1B) served A la Carte at baseline and end of study in Intervention and Control Schools.
* Footnote: Not all categories of A la Carte snacks/desserts are shown. A few other types of items were served (including donuts, nuts, yogurts, etc.) but were not well represented across all schools or were served in very limited quantities.

