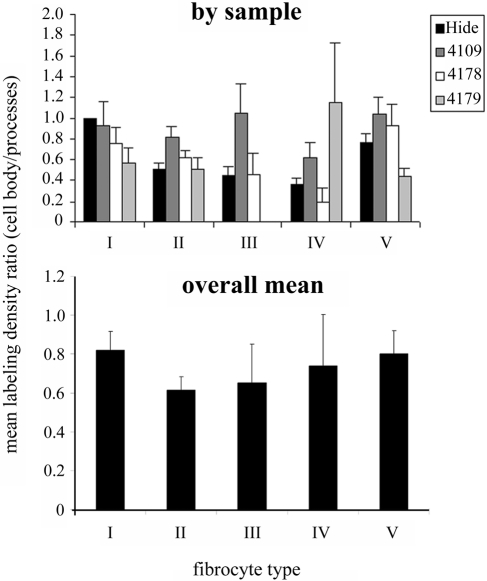
Figure 10.
Histograms showing the ratio of labeling density for α1Na,K-ATPase on the cell body to labeling density on fine processes for all types of fibrocytes in all samples (upper) and the mean across the four samples (lower). In nearly all samples and fibrocytes, the ratio is less than one, showing a tendency for α1Na,K-ATPase to be enriched on the plasma membrane of the fine processes rather than the cell body. From the mean values, this ratio is lowest for type II cells and highest for type I cells. Bars = SEM.

