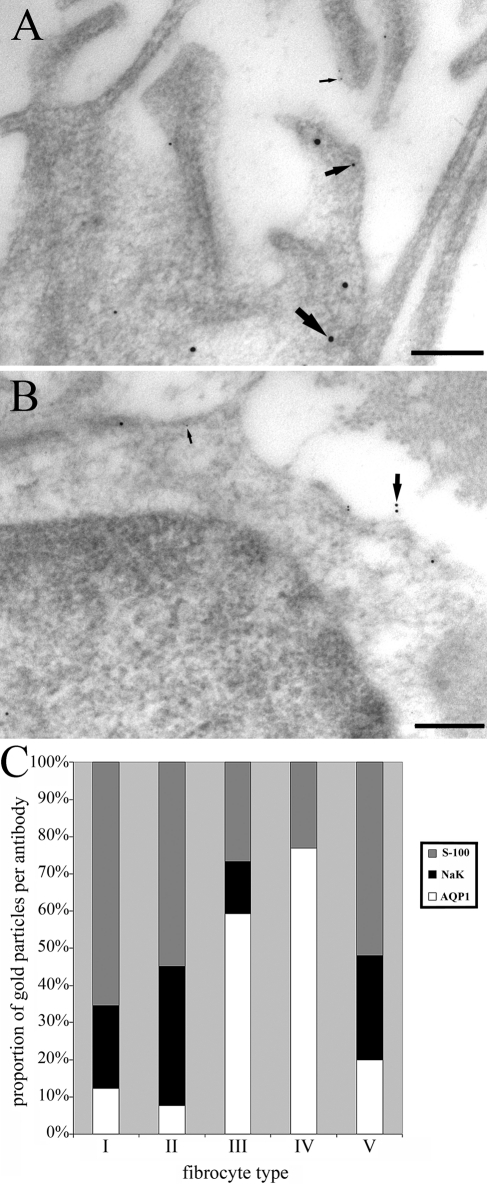
Figure 11.
Triple labeling for AQP1, Na,K-ATPase, and S-100. (A) In type II fibrocytes, labeling with all three markers is visible, as indicated by the large, intermediate, and small arrows indicating 15 nm (S-100), 10 nm (AQP1), and 5 nm (Na,KATPase) gold particles, respectively. (B) In type III fibrocytes, only the 10 nm and 5 nm particles are visible in this example because of the lower expression of S-100. Scale bars = 200 nm. (C) Histogram showing the relative amount of labeling for each antibody in the triple-labeled sample. Counts were conducted in 10 images of each fibrocyte type in one section and the proportion of each particle size displayed for each type. The patterns are unique for each type, but note that the most similar pattern is found between type II and type V fibrocytes, which are hard to distinguish.

