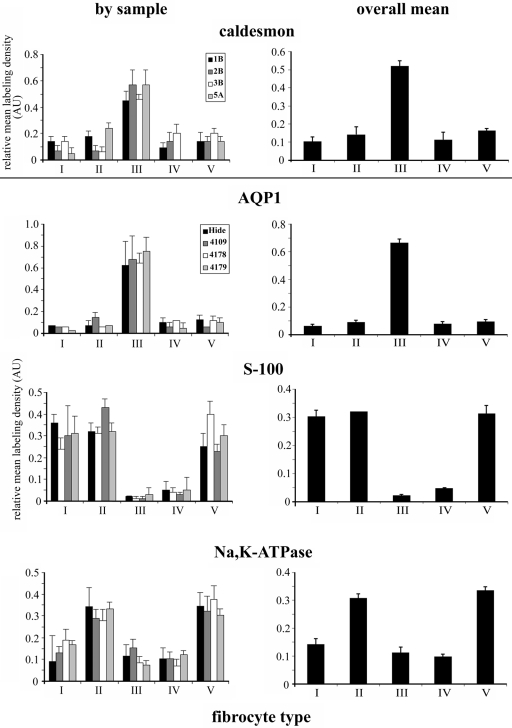
Figure 9.
Histograms showing the relative labeling density in fibrocytes from each sample (left) and the mean across all four samples (right) for caldesmon (above line) (samples 1B, 2B, 3B, and 5A), AQP1, S-100, and α1Na,K-ATPase (below line) (samples Hide, 4109, 4178, and 4179). Caldesmon and AQP1 are most highly expressed in type III fibrocytes, with the latter to a greater extent. S-100 is expressed to a similar extent in types I, II, and V and is only weakly present in types III and IV. α1Na,K-ATPase is expressed most strongly and to a similar degree in type II and type V fibrocytes and more weakly in types I, III, and IV. Bars = SEM.

