
Figure 6. (A) Chemical signals are partially responsible for isolation.
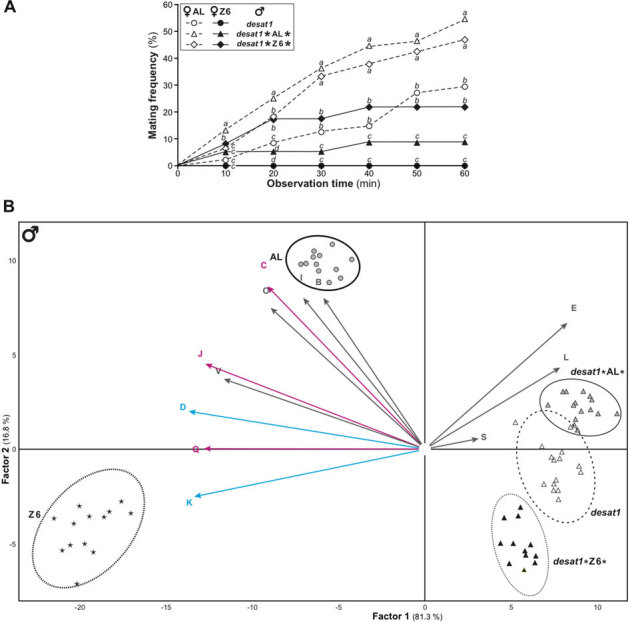
Cumulative mating curves for AL and Z6 females with desat1 males that were either unmanipulated (desat1) or received hydrocarbons from AL males (desat1*AL*) or from Z6 males (desat1*Z6*). n = 48–80. Letters indicate significant differences. (B) Discriminant analysis of male flies from AL, Z6 and desat1 strains, and from males that had pheromone transfers (desat1*AL* and desat1*Z6*), projected onto the first two principal components. Equiprobable ellipses correspond to 95% probability. The various components in the cuticular cocktail were also projected onto these components (arrows) to give a sense of dimensionality. We conducted a forward stepwise discriminant analysis (with an entry threshold value of p = 0.05 and a removal threshold value of p = 0.10) using the additive/log ratio transformed proportion of the CHs) using the absolute amount of the uncorrelated CHs as quantitative variables and the strain as a qualitative variable. Magenta arrows indicate C7 compounds, cyan arrows indicate C5 compounds, black arrows indicate others compounds.