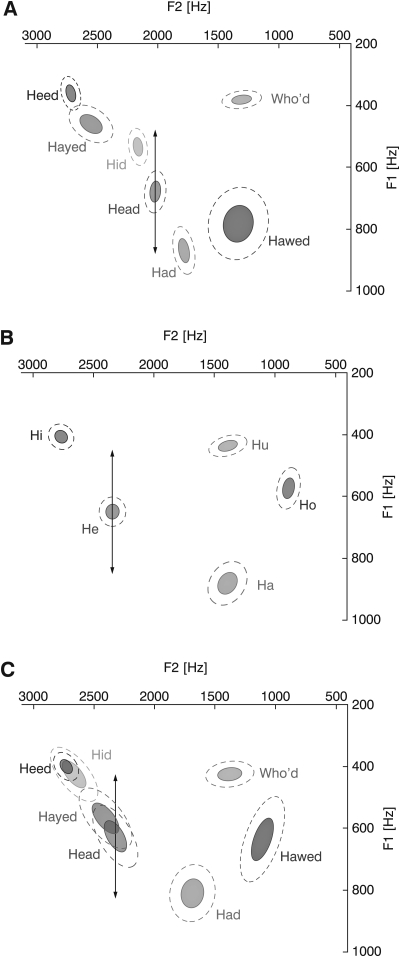
Figure 6.
(Color online) Vowel space of an average individual speaker from (A) ENG L1, (B) JPN L1, and (C) JPN L2 groups. The centroid of each ellipse represents the average F1/F2 value for that vowel. The solid and dashed ellipses represent one and two standard deviations, respectively. The arrows indicate the 200 Hz perturbation and the arrow tips indicate what the acoustic feedback speakers would have heard if they did not compensate.

