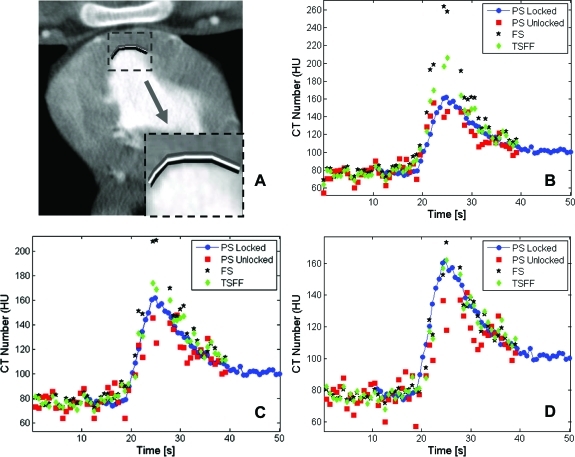
Figure 7.
Tradeoff between PSR artifacts and motion artifacts at (a) three adjacent and thin ROIs with similar contours close to the endocardial border, (b) TACs from innermost ROI (in black), (c) TACs from medium ROI (in white), and (d) TACs from outermost ROI (in gray). ROIs are two to three voxels thick. The TACs correspond to the scan 5 min after injection of adenosine.

