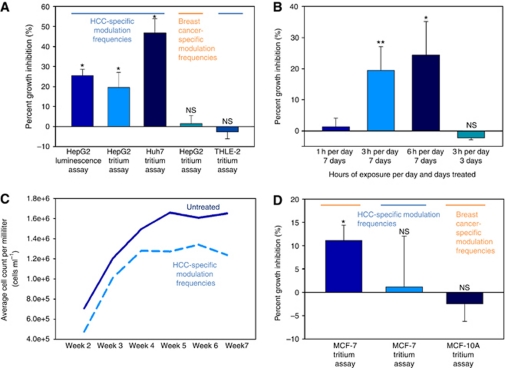
Figure 2.
Cell proliferation assays of cell lines exposed to HCC-specific or breast cancer-specific modulation frequencies. (A) Cells were not split after initial seeding; medium was exchanged every 48 h. Experiments were performed with both equipment setups. Left to right columns: (1) HepG2 cells exposed to HCC-specific modulation frequencies with GI evaluated with a luminescence assay, 25.46±3.22% GI (P=0.0009). (2) HepG2 cells exposed to HCC-specific modulation frequencies with GI evaluated using tritium incorporation, 19.44±7.60% GI (P=0.00993). (3) Huh7 cells exposed to HCC-specific modulation frequencies, 47.73±7.14% GI (P=0.018). (4) HepG2 cells are not significantly inhibited when exposed to breast cancer-specific modulation frequencies, 1.49±3.99% GI (P=0.8815). (5) THLE-2 cells are not affected by HCC-specific modulation frequencies, −2.54±3.54% GI (P=0.6550). Values represent average percent GI (n=6)±%STERR. (B) Cell proliferation assays exposing cells for varying hours per day. Left to right: 1 h per day 1.36±2.77% (P=0.8508); 3 h per day 19.44±7.60% (P=0.0099); 6 h per day 24.46±10.75% (P=0.0301); 3 h per day for 3 days −2.12±0.66% (P=0.4067). Values represent average percent GI (n=6)±%STERR. (C) Cumulative decrease in cell counts over time when HepG2 cells are exposed to HCC-specific modulation frequencies. Samples were subcultured by volume every 7 days (1 : 20 split by volume). Average total cells mL−1 per week: week 2: 7.07 × 10⁵, 4.75 × 10⁵; week 3: 1.20 × 10⁶, 1.01 × 10⁵; week 4: 1.50 × 10⁵, 1.28 × 10⁵; week 5: 1.66 × 10⁵, 1.22 × 10⁵; week 6: 1.61 × 10⁶, 1.34 × 10⁶; week 7: 1.65 × 10⁶, 1.24 × 10⁶ for untreated and treated samples, respectively. For the duration of the 7-week experiment with time considered as a covariate: P=0.005751. (D) Left to right columns: (1) MCF-7 cells exposed to breast tumour-specific modulation frequencies, 11.08±3.30% GI (P=0.0230). (2) MCF-7 cells are not significantly inhibited when exposed to HCC-specific modulation frequencies, 1.49±3.99% (P=0.8815) GI, respectively. (3) MCF-10A cells are not affected by breast tumour-specific modulation frequencies, −2.46±3.75% GI (P=0.8579). Values represent average percent GI (n=6)±%STERR.

