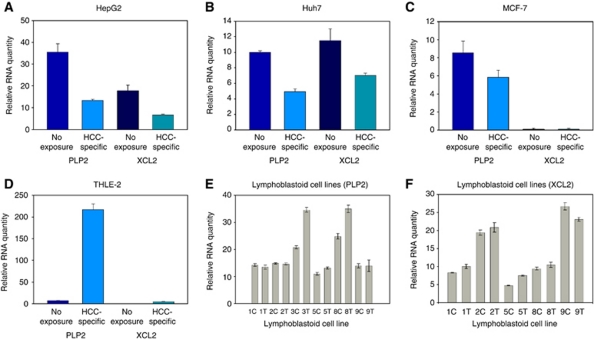
Figure 3.
Expression of XCL2 and PLP2 receiving HCC-specific RF EMF compared with cells not receiving exposure. (A) HepG2: PLP2 (35.46±3.85; 13.17±0.70) and XCL2 (17.87±2.49; 6.52±0.48) (P=9.0371e-3 and P=0.0179, respectively). (B) Huh7: PLP2 (10.02±0.19; 4.95±0.35) and XCL2 (11.52±1.49; 7.02±0.29) (P=9.4981e-5 and P=0.0536, respectively). (C) MCF-7: PLP2 (8.52±1.30; 5.84±0.77) and XCL2 (levels not detectable). (D) THLE-2: PLP2 (7.11±0.14; 216.89±13.18) and XCL2 (0.03±0.01; 4.55±1.04) in THLE-2 cells exposed to HCC-specific modulation frequencies (P=5.5108e-4 and P=0.0221, respectively). (E) Expression levels of PLP2 in lymphoblastoid cell lines (C=unexposed; T=HCC-specific exposure) (for all cell lines compiled P=0.418), LCL 3 expression was significant P=0.0021 as was LCL8 P=0.0159 (F) Expression levels of XCL2 in lymphoblastoid cell lines (for all cell lines compiled (P=0.899), LCL 1 expression difference was significant P=0.0002. Values represent average relative RNA expression (n=4)±s.e.m. Levels were normalised to levels of GAPDH.

