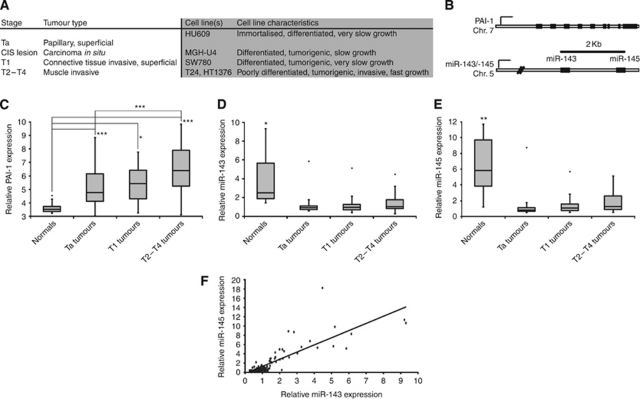
Figure 1.
PAI-1 and miR-143/-145 expression in clinical bladder specimens. (A) White background: overview of bladder cancer stage classification. Grey background: description of cell lines used in this study placed next to tumour grade origin (adapted from Wiklund et al (2011)). (B) Graphical depiction of the PAI-1 and miR-143/-145 genomic loci. (C) Affymetrix exon array relative PAI-1 expression in normal bladder tissues (n=9), Ta tumours (n=49), T1 tumours (n=8) and T2–T4 tumours (n=34). (D and E) Exiqon LNA array relative expression of miR-143 and -145 in normal bladder tissues (n=11), Ta tumours (n=30), T1 tumours (n=47) and T2-T4 tumours (n=27; adapted from Dyrskjot et al (2009)). (F) Scatter plot analysis of miR-143/-145 expression correlation in the bladder samples from (D and E; P=5.6E-33). (*P<0.05, **P<0.01, ***P<0.001 compared with all other groups individually or as indicated with bridging bars. Rounded dots in box plots indicate maximum outliers. P-values determined by 2-tailed Student's t-test).

