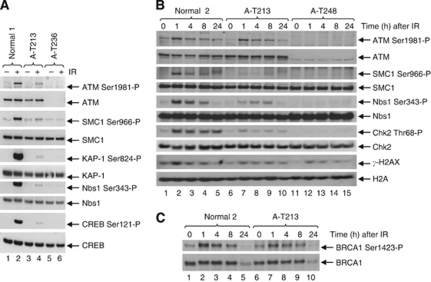
Figure 4.
ATM from A-T213 LCL and fibroblast lysates shows some retained ATM kinase activity. (A) A-T213 LCL lysate (lanes 3 and 4) shows the presence of some ATM kinase activity towards the ATM targets Smc1, KAP1, Nbs1 and CREB after exposure to IR, but this is reduced compared with lysate from a normal LCL (lanes 1 and 2). LCL lysate from a classical A-T patient A-T236, which does not express ATM, is shown in lanes 5 and 6. (B and C) Time course of phosphorylation of different ATM downstream targets by A-T213 fibroblast ATM protein, showing the presence of kinase activity at 1 h compared with the classical A-T patient (A-T248) but reduced activity compared with normal ATM (normal 2).

