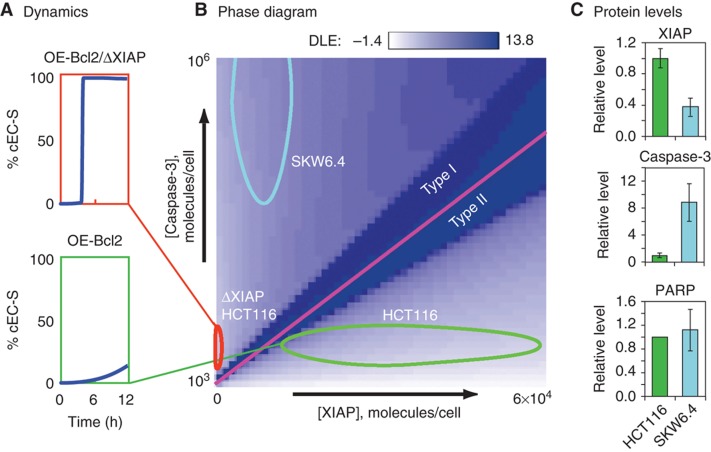
Figure 1.
A DLE phase diagram predicts that XIAP deletion in HCT116 cells switches them from type II to type I. (A) Dynamics. Simulation of EC substrate cleavage in TRAIL-treated OE-Bcl2 HCT116 (green) and OE-Bcl2/ΔXIAP HCT116 (red) cells using EARM1.4. (B) Phase diagram. DLE values for OE-Bcl2 conditions and 50 ng/ml TRAIL at 8 h. The DLE is visualized in a slice of phase space corresponding to caspase-3 levels of 1 × 10³–106 molecules/cell and XIAP levels of 0–6 × 10⁴ molecules/cell in linear scale. High DLEs demarcate a separatrix (magenta) that separates cells exhibiting type I behavior (that die despite Bcl2 over-expression) or type II behavior (that survive). Ovals denote the positions in phase space of HCT116 parental (green), ΔXIAP HCT116 (red), and SKW6.4 (cyan) cells, based on measurements of protein levels (Box 1 Table, Box 2 Table, and Supplementary Figure S1). (C) Protein levels. XIAP, caspase-3, and PARP concentrations in two cell lines as measured by quantitative immunoblots, relative to levels found in HCT116 cells; HCT116 (green, set to 1) and SKW6.4 (cyan) cells; immunoblot images are shown in Supplementary Figure S1A. Source data is available for this figure in the Supplementary Information.

