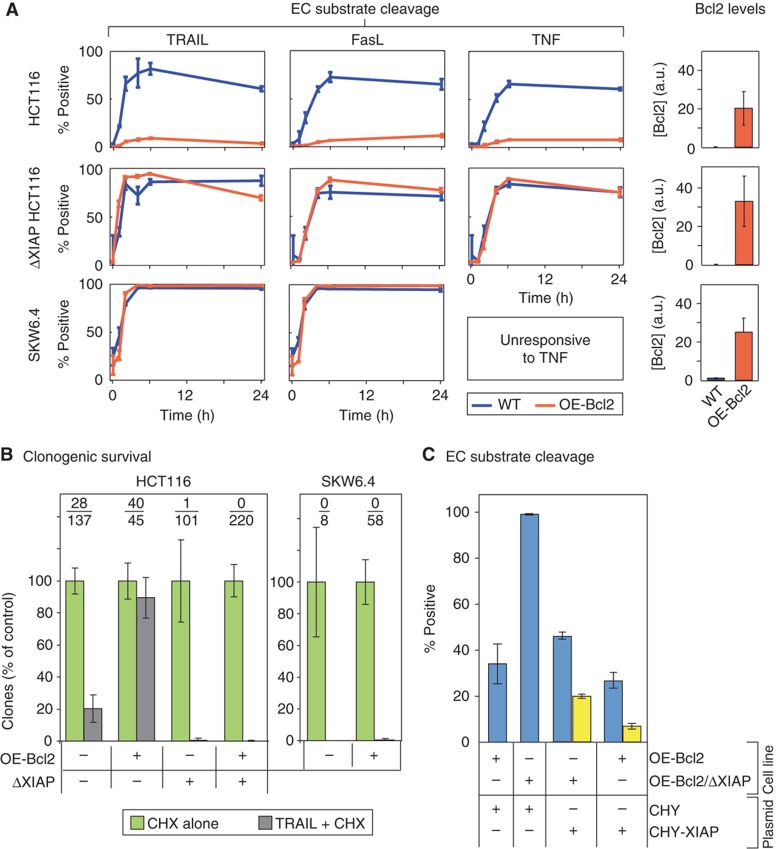
Figure 2.
XIAP deletion in HCT116 cells switches them from type II to type I. (A) Time courses of cell death in cell lines having Bcl2 at normal (WT, blue lines) or over-expressed levels (OE-Bcl2, orange lines) following exposure to TRAIL (50 ng/ml), FasL (100 ng/ml), or TNF (100 ng/ml). The percentages of cells positive for cleaved EC substrate (cEC-S) was determined by flow cytometry with antibodies specific for cPARP (Supplementary Figure S2). Because of the nature of the targeted epitope, these antibodies can recognize other cleaved EC substrates in addition to cPARP, and we therefore refer to these as measures of ‘cleaved EC substrate.’ Bar plots to the right show Bcl2 expression in each cell line, relative to SKW6.4 (set to 1; Supplementary Figure S1). We assayed parental HCT116 colorectal carcinoma cells (top), HCT116 cells carrying a homozygous deletion of the XIAP gene (Cummins et al, 2004) (middle), and the SKW6.4 EBV-transformed B lymphocyte line (bottom). (B) Clonogenic survival. Bar plots showing the relative number of clones obtained in HCT116-derived cells (left) and SKW6.4 and OE-Bcl2 SKW6.4 cells (right) following TRAIL treatment, normalized to a CHX alone control. Average numbers of clones obtained are indicated (TRAIL-treated/control). (C) EC substrate cleavage. Fraction of OE-Bcl2 or OE-Bcl2/ΔXIAP HCT116 cells positive for EC substrate cleavage 6 h after TRAIL addition following transfection with plasmids expressing mCherry alone (CHY) or mCherry fused to XIAP (CHY-XIAP). TRAIL was added 18 h following transfection and EC substrate cleavage assayed by flow cytometry. Data are shown for cells expressing CHY-XIAP at endogenous (blue) and 20-fold over-expression levels (yellow; see Supplementary Figure S5A for quantification). All experiments were performed in the presence of 2.5 μg/ml of CHX (responses to CHX or TRAIL alone are shown in Supplementary Figures S3 and S4). Error bars report the standard deviation of biological triplicates from one representative experiment. Source data is available for this figure in the Supplementary Information.

