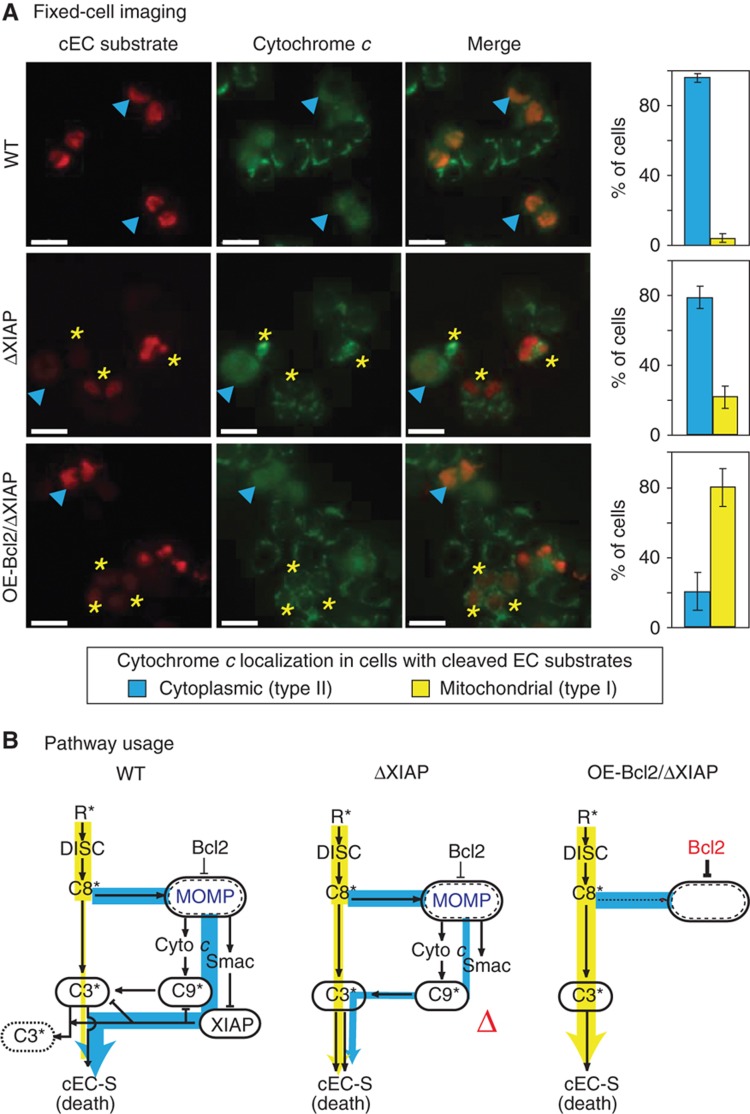
Figure 3.
ΔXIAP HCT116 cells undergo MOMP prior to caspase-3/7 activation unless Bcl2 is over-expressed. (A) Fixed-cell imaging of WT (top), OE-Bcl2 (middle), and OE-Bcl2/ΔXIAP (bottom) HCT116 cells stained for cleaved EC substrates and cytochrome c 1 h after addition of 50 ng/ml TRAIL+2.5 μg/ml of CHX (scale bar=20 μm). Examples of cells positive for EC substrate cleavage in which cytochrome c has been translocated to the cytoplasm (an indicator of MOMP) are denoted by cyan arrowheads; cells positive for EC substrate cleavage in which cytochrome c is still restricted to mitochondria are denoted by yellow asterisks. Bar plots report the percentages of cEC-S-positive cells where cytochrome c is cytoplasmic (blue) or mitochondrial (yellow). Error bars report the standard deviation of biological triplicates from three wells counting ∼200–600 cells/well from one representative experiment (see Materials and methods). (B) Pathway usage. Schematic interpretations of the results in Figure 2 and (A) above. Degraded caspase-3 is indicated with a dotted outline. Bcl2 over-expression inhibited mitochondrial permeabilization in XIAP-deficient HCT116 cells (OE-Bcl2/ΔXIAP HCT116 cells; right). Source data is available for this figure in the Supplementary Information.

