Figure 6.
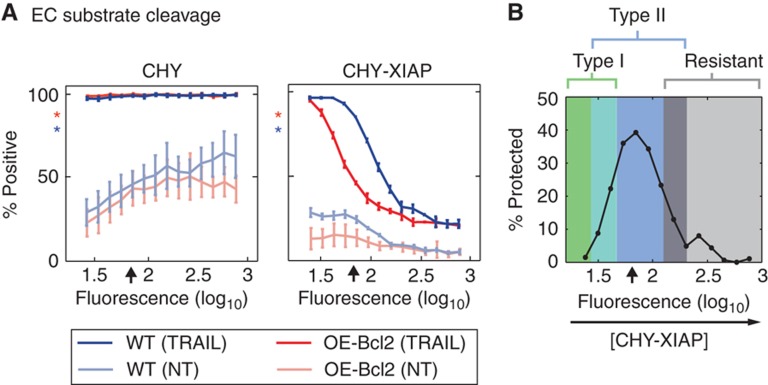
XIAP levels control the fraction of HCT116 cells that exhibit type I versus type II phenotype. (A) EC substrate cleavage. Cell death (percentage positive) in TRAIL-treated ΔXIAP (blue) and OE-Bcl2/ΔXIAP (red) HCT116 cells expressing mCherry alone (CHY; left) or mCherry fused to full-length XIAP (CHY-XIAP; right), as measured by cEC-S by flow cytometry. Untreated transfected cells are shown in light blue and red (NT). Percentages of cells positive for cEC-S (measured with anti-cPARP) and CHY protein intensity (594 nm fluorescence) were measured by flow cytometry (representative raw data are shown in Supplementary Figure S5). The average endogenous XIAP level is denoted with an arrow (see Supplementary Figure S5 for quantification) and asterisks indicate the responses of untransfected cells. Error bars report the standard deviation of biological triplicates from one representative experiment. (B) Percentages of cells that were protected from apoptosis specifically by Bcl2 over-expression, as a function of CHY-XIAP levels. Percentages of protected cells were calculated by subtracting the percentage of cEC-S-positive cells in OE-Bcl2/ΔXIAP HCT116 cells from those of ΔXIAP cells and delineate type I, type II, and apoptosis-resistant regions. Source data is available for this figure in the Supplementary Information.

