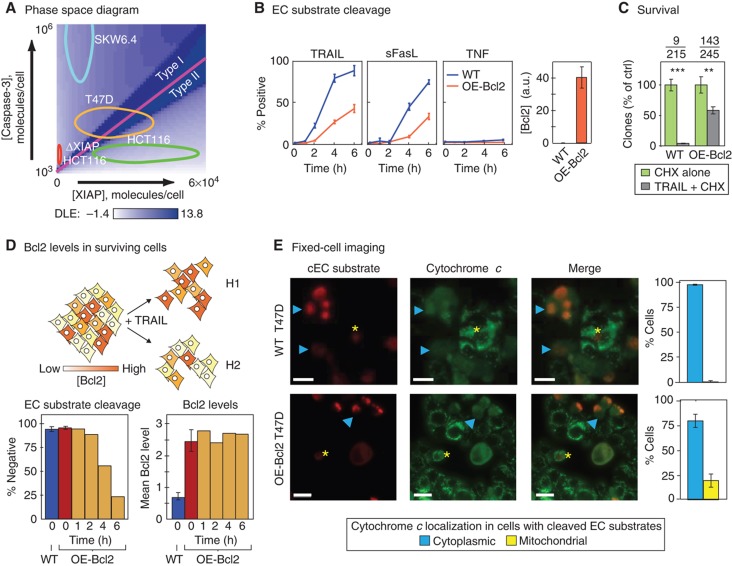
Figure 7.
Individual T47D cells can exhibit either a type I or type II phenotype. (A) Phase-space diagram. Ovals representing variation in [XIAP] and [caspase-3] in HCT116, T47D, and SKW6.4 cells (as measured by flow cytometry) are mapped onto the phase diagram. (B) Time courses of EC substrate cleavage in T47D cells having Bcl2 at normal (WT, blue lines) or over-expressed levels (OE-Bcl2, orange lines) following exposure to TRAIL (50 ng/ml), FasL (100 ng/ml), or TNF (100 ng/ml) in the presence of 2.5 μg/ml of CHX (responses to CHX or TRAIL alone are shown in Supplementary Figures S3 and S4). Percentages of cells positive for EC substrate cleavage were determined by flow cytometry. Bar plots to the right show Bcl2 expression in each cell line, relative to WT SKW6.4 (set to 1, see Figure 2A and Supplementary Figure S1). Error bars report the standard deviation of biological triplicates from one representative experiment. (C) Survival. Clonogenic assay of WT and OE-Bcl2 T47D cells following 6 h of TRAIL treatment, percentages were obtained by normalizing to CHX alone control. Average numbers of colonies are indicated above the graph (TRAIL-treated/control). Error bars report the standard deviation of biological triplicates from one representative experiment. (D) Bcl-2 levels in surviving cells. Schematic showing two possible hypotheses (H1 and H2) to explain why only a subset of T47D cells are protected from death ligand by Bcl2 over-expression. Assuming an untreated population in which Bcl2 levels vary (indicated with different shades of orange) it is possible that only cells with high Bcl2 levels survive TRAIL treatment (upper model, H1); alternatively, cell survival might be determined by other, unknown, factors such that Bcl2 levels in survivors end up similar to those in the untreated cell population (lower model, H2). Bar plots show the percentages of cells that are negative for EC substrate cleavage (lower panel, left) and mean Bcl2 expression levels in these cells (lower panel, right), as measured by flow cytometry in parental T47D cells (blue) and in OE-Bcl2 T47D cells prior to TRAIL treatment (red) and following 50 ng/ml TRAIL + 2.5 μg/ml of CHX exposure for 1–6 h (orange; right). Error bars report the standard deviation of biological triplicates from one representative experiment, the same trends were observed in multiple experiments. (E) Fixed-cell images of WT (top) and OE-Bcl2 (bottom) T47D cells stained for EC substrate cleavage and cytochrome c 3.5 h after 50 ng/ml TRAIL + 2.5 μg/ml of CHX addition (scale bar=20 μm). Arrowheads (cyan) denote cells positive for both EC substrate cleavage and cytoplasmic translocation of cytochrome c and asterisks (yellow) denote cells positive for EC substrate cleavage but having cytochrome c restricted to mitochondria. Bar plots report the percentages of EC substrate cleavage positive cells where cytochrome c is cytoplasmic (blue) or mitochondrial (yellow). Error bars report the standard deviation of biological triplicates from three to five wells, counting ∼150–700 cells/well (see Materials and methods). Source data is available for this figure in the Supplementary Information.

