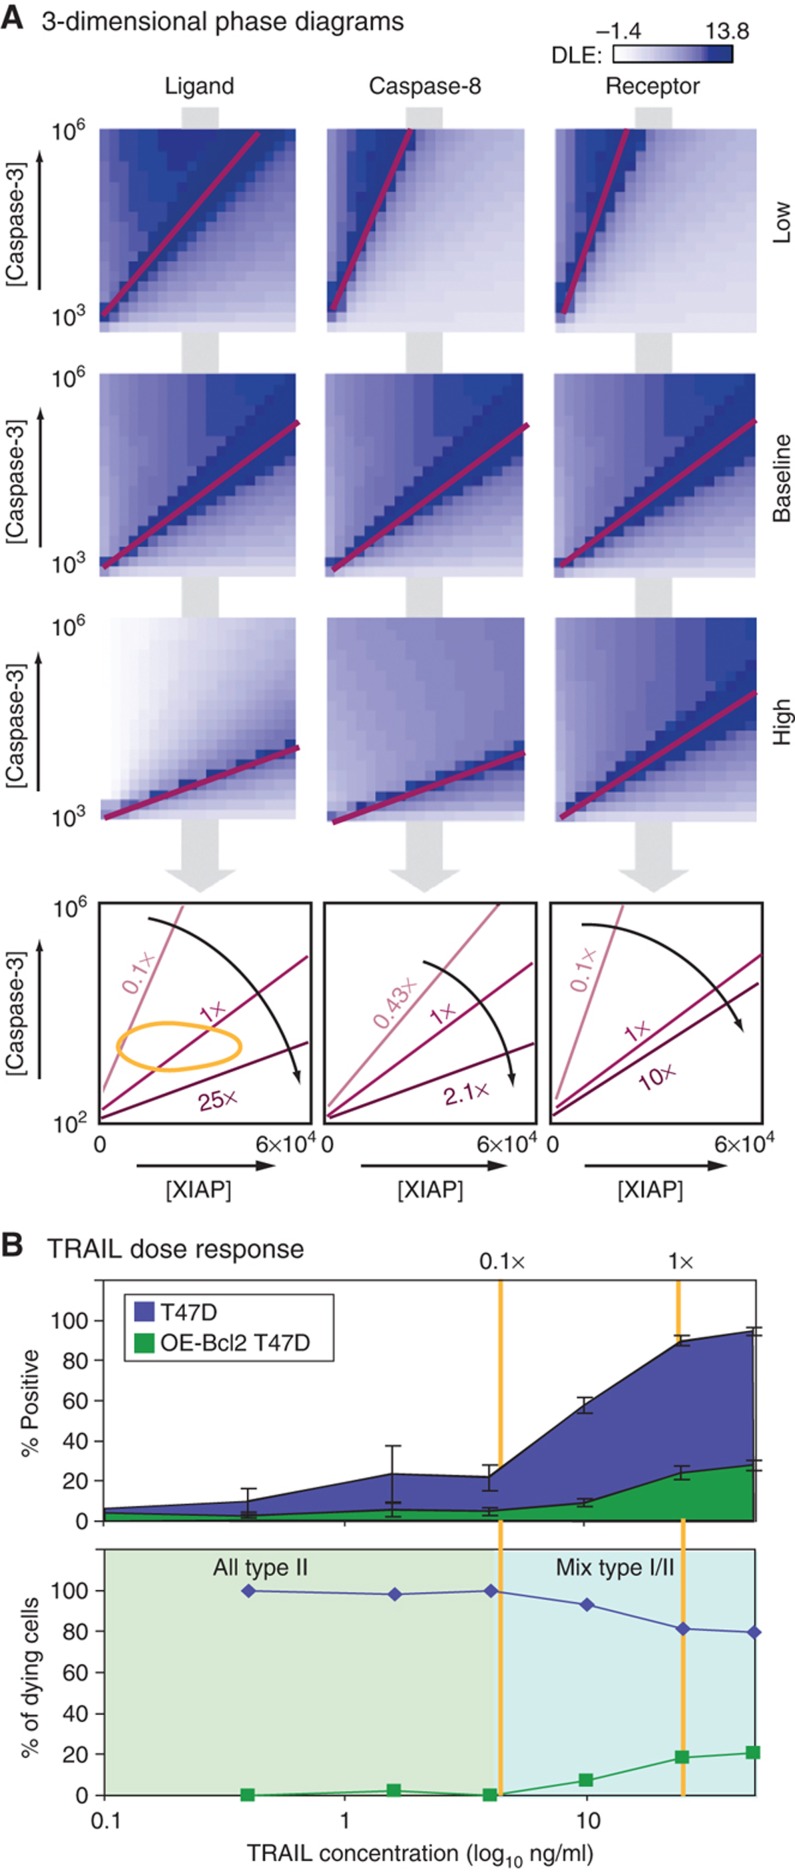
Figure 8.
The proportion of type I and type II T47D cells is dependent on TRAIL concentration. (A) Positions of the separatrix in the [XIAP] versus [caspase-3] dimensions under conditions in which ligand, caspase-8, or receptor levels were changed as indicated (fold decrease or increase from the baseline; see Materials and methods). The type I region widens as the separatrix shifts toward the [XIAP] axis. (B) TRAIL dose response. Graphs show the fraction of dying T47D cells that are WT or OE-Bcl2 (lower panel) as calculated from a dose-response curve to TRAIL concentration + 2.5 μg/ml CHX (upper panel). Error bars report the standard deviation of biological triplicates from one representative experiment. Source data is available for this figure in the Supplementary Information.

