Figure 9.
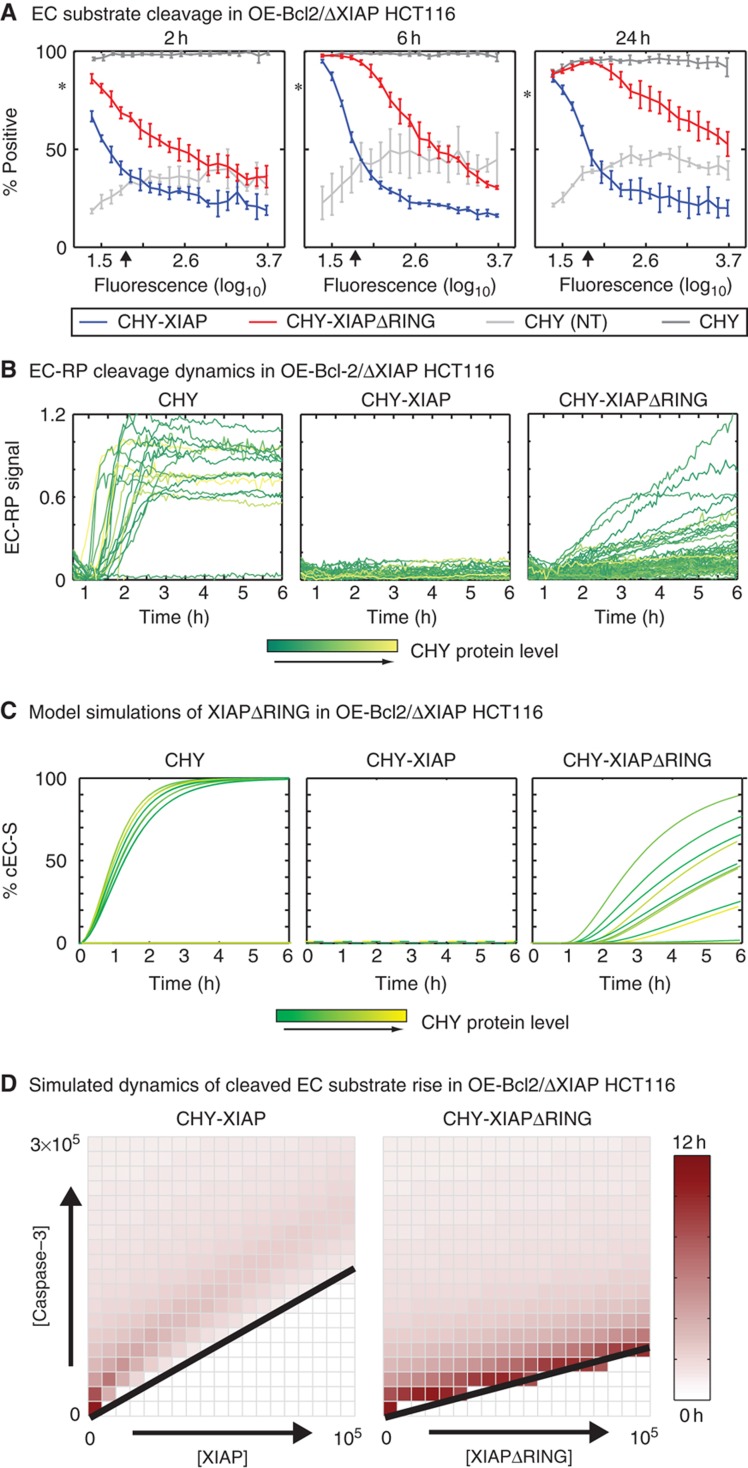
Deletion of the XIAP RING domain disrupts the dynamics of effector caspase activation. (A) EC substrate cleavage in OE-Bcl2/XIAP HCT116. Cell death (percentage positive) in TRAIL-treated OE-Bcl2/ΔXIAP HCT116 cells expressing mCherry alone (CHY; dark gray), mCherry fused to full-length XIAP (CHY-XIAP; blue), or mCherry fused to an XIAP truncation lacking the RING domain (excluding residues 437–497, CHY-XIAPΔRING; red). Untreated mCherry-transfected cells are shown in light gray (CHY (NT)). EC substrate cleavage and CHY protein intensity (594 nm fluorescence) were measured by flow cytometry (representative raw data are shown in Supplementary Figure S6C). Average endogenous XIAP level is denoted with an arrow and the responses of untransfected cells indicated with asterisks. As discussed in the text, transfection itself sensitizes cells HCT116 cells to TRAIL, and it is therefore necessary to compare the red and blue data to the control data in light gray. Error bars report the standard deviation of biological triplicates from one representative experiment. (B, C) Dynamics of EC-RP cleavage as determined by live-cell microscopy (B) and predicted by simulation (C) for TRAIL-treated OE-Bcl2/ΔXIAP HCT116 cells transfected with mCherry alone (CHY; left), mCherry fused to full-length XIAP (CHY-XIAP; center), or mCherry fused to a RING-domain deletion mutant of XIAP (CHY-XIAPΔRING; right). The level of mCherry fluorescence is reported using a scale from yellow to green, as indicated. (D) Simulated duration of cleaved EC substrate rise in OE-Bcl2/XIAP HCT116. 2D phase space maps showing how the duration of the rise in cleaved EC substrate for wild-type XIAP (left) and XIAPΔRING (right) is dependent on the concentration of the XIAP and caspase-3 species in model simulations. For XIAPΔRING, the rate parameter for XIAP E3 ligase activity toward its caspase-3 substrate is set to zero. Black lines represent the demarcation between type I versus II phenotypes as determined by fraction of cleaved EC substrate in these simulations, with type I cells mapping above and type II cells below (Supplementary Figure S8). Source data is available for this figure in the Supplementary Information.

