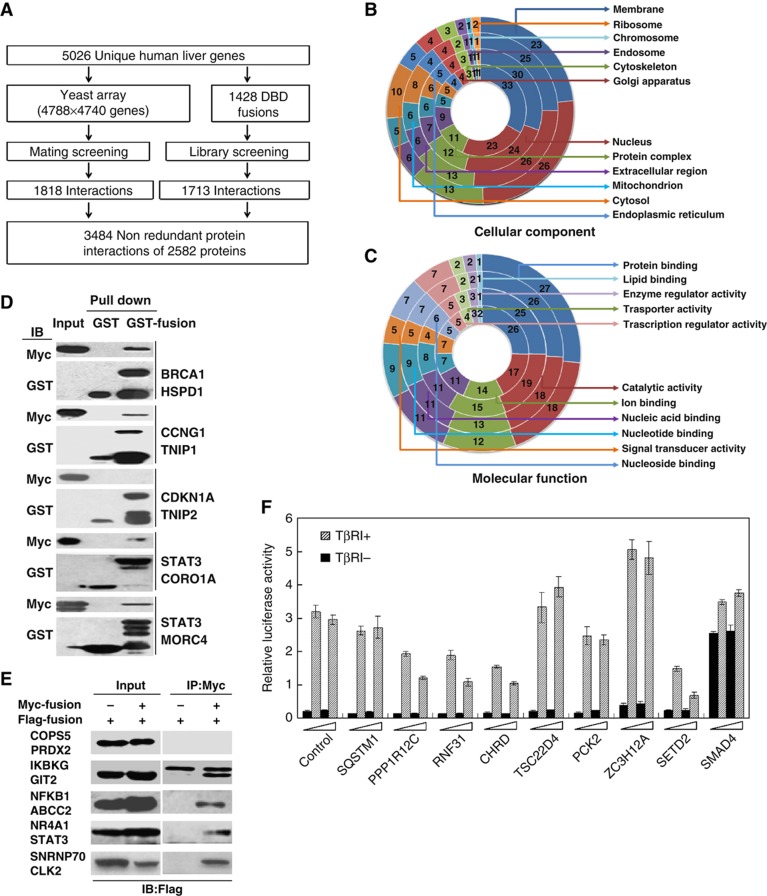
Figure 1.
Construction of the proteome-scale HLPN. (A) Strategy of high-throughput Y2H screening. (B, C) Distribution of the GO categories of cellular component (CC) and molecular function (MF). From inside to outside, the rings represent all of the human proteins (16 022 with CC and 15 259 with MF annotations), human liver proteins (12 066 with CC and 10 863 with MF annotations), Y2H matrix proteins (4553 with CC and 4374 with MF annotations) and HLPN proteins (2342 with CC and 2252 with MF annotations). Each section reflects the percentage of proteins assigned to the given GO category. (D) GST pull-down assay. Bacteria-expressed GST or GST-tagged proteins were immobilized on glutathione-Sepharose 4B beads, and the beads were subsequently incubated with the Myc- or Flag-tagged proteins expressed in the HEK293T cell lysates. The proteins were detected using the indicated antibodies. (E) Co-IP assay. Flag- or Myc-tagged plasmids were transfected into HEK293T cells. Immunoprecipitations were performed using anti-Myc or anti-Flag antibodies and protein A/G-agarose. The lysates and immunoprecipitates were detected using the indicated antibodies. Myc-, GST- and Flag-fusions mean the fusion proteins with Myc, GST or Flag tags. (F) Luciferase reporter gene assays of SMAD3. Data are presented as mean values±s.d. (n=3). The results are representative of three independent experiments.

