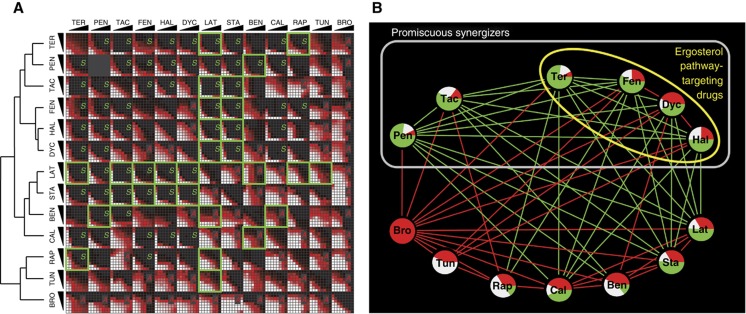
Figure 3.
Synergy tests between all pairs among 13 drugs. (A) Drug pairs were combined in 8 × 8 matrices where the concentration of one drug was linearly increased along each axis. Green squares correspond to drug pairs that target proteins encoded by synergistic genes. We found 32 significant synergies (S) and 27 significant antagonisms (A) among the 78 drug–drug interactions tested. Hierarchical clustering of drug interaction score profiles is shown on the left. (B) Network representation of the synergistic and antagonistic drug interactions shown in (A). Edges reflect the interaction type between two drugs and the node pie charts represent the ratio of different types of interactions each drug has in this data set (green: synergy, white: independent; red: antagonism; independence edges are omitted for clarity). Gray box indicates the promiscuous synergizers learned from the drug interaction network in this figure. Yellow circle shows the drugs that target the ergosterol pathway in yeast. For drug name abbreviations, see Table I.

