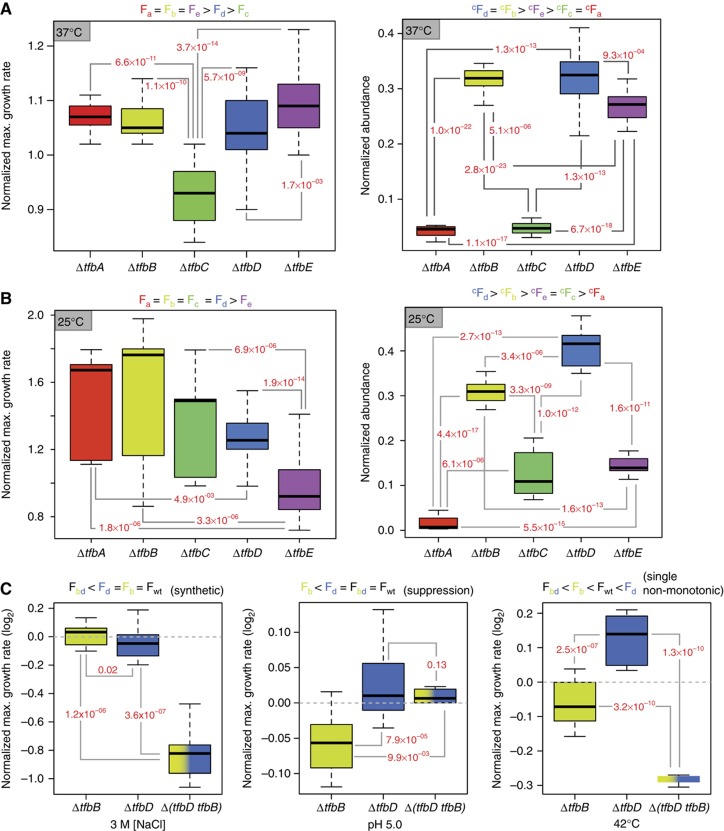
Figure 3.
Functional hierarchies and genetic interactions of TFBs change with environmental context. Relative fitness levels of TFB knockouts in pure cultures at 37°C (A, left) and 25°C (B, left) were determined as described in Figure 2. Competition experiments were performed by mixing equal numbers of cells of each TFB knockout grown to mid-log phase of growth. The mixed cultures were incubated at 37°C (A, right) or 25°C (B, right) to OD600∼0.4 when they were serially diluted into fresh medium to a final OD600 of 0.05. The competition was performed over ∼22 generations and relative success of each TFB was determined by tracking the relative abundance of the knockout strains with qRT–PCR. Significance of fitness differences between pairs of TFBs was determined using two-sample t-test and P-values for significant changes are reported in red font adjacent to lines connecting respective TFB pairs. Ranking of relative fitness of each TFB knockout is indicated on top of each plot. (F: fitness in pure cultures; cF: fitness in competition.) Difference in rank order of F and cF of knockouts in the same environment suggest division of labor among the TFBs that is not at all apparent when they are cultured individually. Consistent with the results in Figure 2B, difference in cF across environments (25 and 37°C) further demonstrates that the TFBs switch their relative roles (primary, secondary, tertiary, etc.) depending on context. (C) Functional (genetic) interactions among TFBs vary by environmental context. Genetic interactions between tfbB and tfbD were determined by assessing fitness differences (t-test, P<0.01) of single (ΔtfbB or ΔtfbD) and double (ΔtfbBΔtfbD) knockout strains. Mode of genetic interactions was assigned based on fitness inequalities indicated on top of each graph (Fb: fitness of ΔtfbB; Fd: fitness of ΔtfbD; Fbd: fitness of ΔtfbB ΔtfbD; Fwt: fitness of WT) per the scheme devised by Carter et al (2009).

