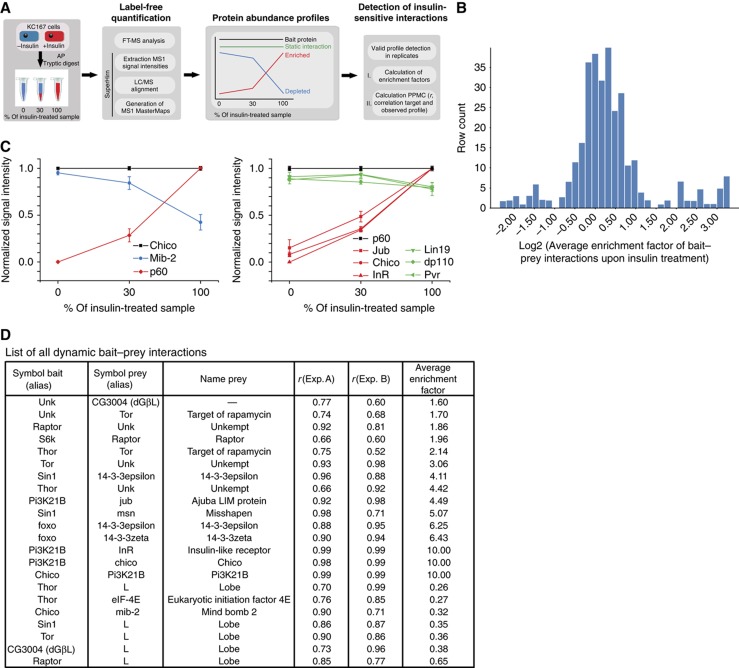
Figure 2.
Quantitative analysis of insulin-sensitive PPIs. (A) Schematic overview on the experimental approach for monitoring insulin-sensitive bait–prey interactions using label-free MS and MS1 alignment (for details see Materials and methods). (B) Examples of dilution experiments in combination with label-free quantification and multiple LC–MS alignment. AP–MS analysis was performed on insulin-treated and -untreated Kc167 cell lines expressing Chico (dIRS) and p60 (Pi3K21B). Protein abundance profiles were normalized against the individual bait profiles of Chico and p60 (black lines). Bait–prey interactions showing changes in abundance upon insulin stimulation are presented as red (increase) and blue (decrease) profiles. Lines in green refer to unaffected protein interactions. Error bars indicate s.e.m. of the average MS1 signal intensity of an individual profile in a particular dilution. (C) Overview on enrichment factor distribution of all quantified protein interactions. The average enrichment factor (AEF) of every PPI were calculated from replicate experiments and plotted over the entire data set. All interactions with a SAINT score >0.8 are shown (see also Materials and methods). (D) List of all observed insulin-sensitive interactions. Pearson product-moment coefficient from linear regression analysis (r) as well as AEF calculated based on profile information between two replicates (Exp. A and B, respectively) are listed.

