Figure 4.
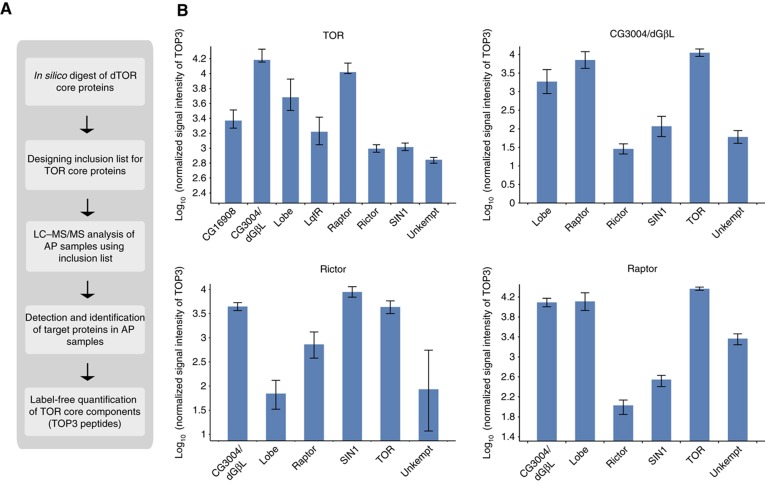
Analysis of dTOR complexes by quantitative AP–MS. (A) Workflow of AP–MS analysis for dTOR complex analysis. Peptide precursor m/z values obtained from tryptic in silico digest of dTOR core components were used for inclusion list-LC/MS/MS experiments. Based on all successfully identified peptide features, label-free quantification was performed and average signal intensities of the three most intense peptides (TOP3) were calculated to represent protein abundances. (B) Abundance distribution of proteins identified in dTOR and dGβL (upper panel), dRictor and dRaptor purifications (lower panel) relative to the bait. The average TOP3 signal intensity was used to infer protein abundances within individual AP–MS/MS experiments (data are listed in Supplementary Table 10). The average signal intensities of dTOR core components in each of the indicated purifications were calculated relative to corresponding bait intensity (set to 10E5) from four purification experiments and are shown in log scale in the bar chart. Error bars represent standard deviation in log scale.

