Figure 1.
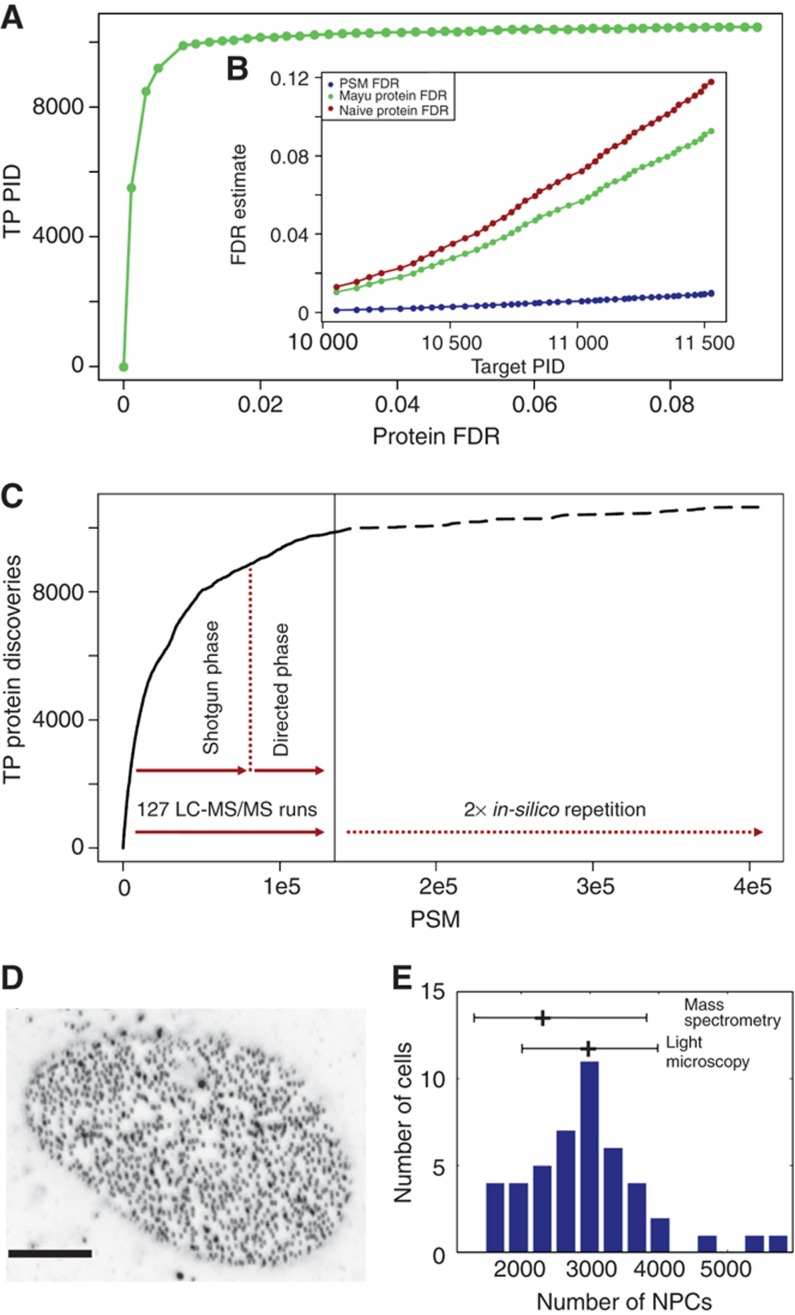
Protein and PSM FDRs for the ‘U2OS data set’ and independent validation of protein copy numbers. (A) Number of expected true positive protein identifications (TP PIDs) for varying protein FDRs. Number of PIDs stagnates at 2% protein FDR (∼0.2% PSM FDR). Stringent PSM filter preserves true PIDs. (B) FDR estimates for different entities as a function of the number of total, i.e., true and false PIDs (target PID). PSM FDR (blue), Mayu protein FDR (green) and the (frequently used and yet) too pessimistic naive protein FDR (Reiter et al, 2009; see Supplementary information for detail) estimate (brown). (C) Proteome coverage prediction (dashed) for repetition of experiments that gave rise to the ‘U2OS data set’ (solid). Number of acquired confident PSMs is plotted against the number of true positive protein discoveries (TP PIDs). Effective saturation coverage reached at level of TP PIDs for given experimental set-up. (D) Confocal section of U2OS cell with punctuate pattern of NPCs stained with monoclonal antibody mAb414 (scale bar 5 μm). (E) Distribution of number of NPCs in U2OS cells as determined by quantification of images from 46 cells as shown in (D). The mean value of 3000 NPCs per cell and the standard deviation of 1000 is displayed and put into relation to the number of NPCs per cell measured by MS and the corresponding precision of the MS method (mean fold error <2; Supplementary Figure S1).

