Figure 3.
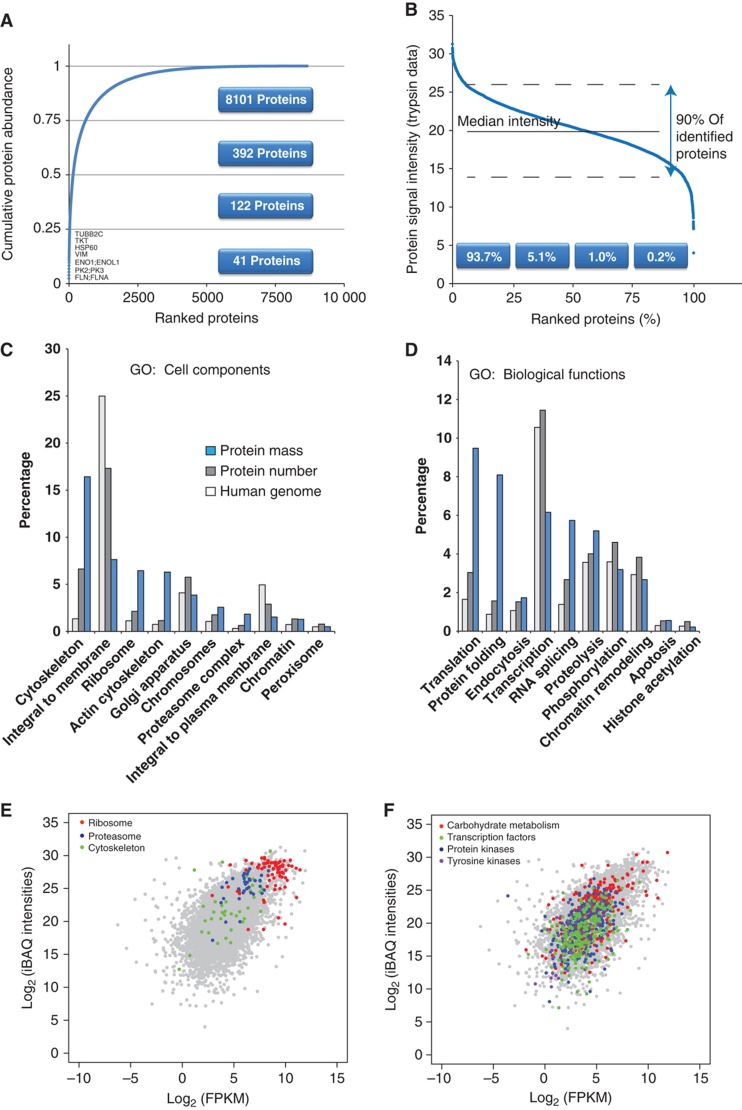
Quantitative analysis of expressed genes. (A) Cumulative protein mass from the highest to the lowest abundance proteins. (B) Ranked protein abundances from the highest to the lowest. (C) Gene ontology analysis of cellular compartments annotations including the percent of the annotated genes in the genome, the percent of the identified proteins and the percent of the protein mass that is attributed to these annotations. (D) Same as (C) but for Gene Ontology biological process annotations. (E) Scatter plot of iBAQ intensities versus FPKM values with highlighting of structural proteins and proteins in basic cellular machineries. (F) Same as (E) but highlighting of metabolic and regulatory proteins.

