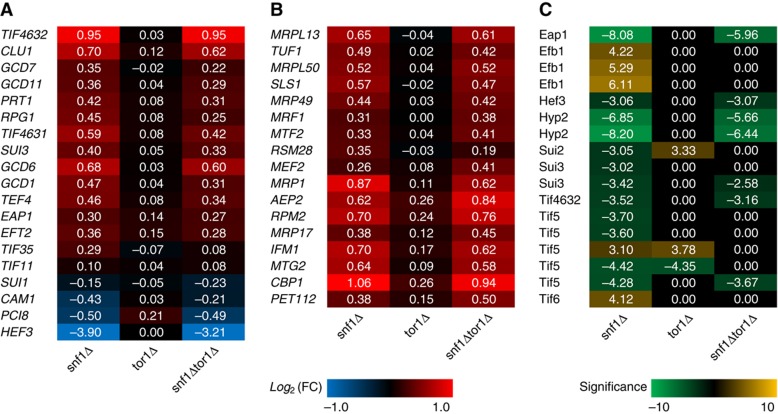
Figure 5.
Regulation of genes and proteins involved in translation on C-limited condition. The red–blue heat map represents the relative changes of gene involved in (A) translation initiation and elongation and (B) mitochondrial ribosome and translation. (C) The yellow–green heat map represents the significance of phosphorylation changes of the proteins involved in translation. Positive numbers indicate higher while negative values indicate lower gene expression or protein phosphorylation in mutant strains compared with the reference on C-limited condition.

