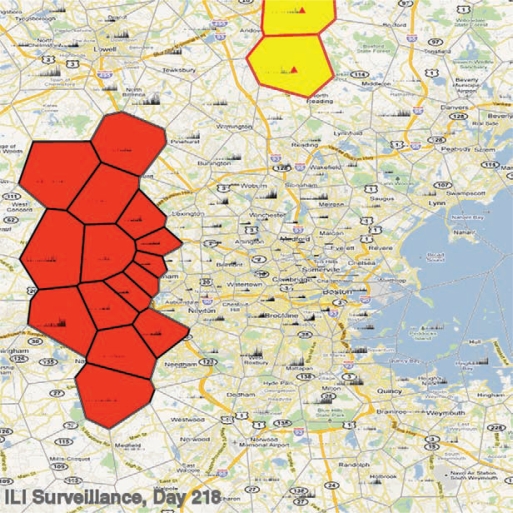
Fig. 1.
Simulated ILI surveillance data for downtown Boston as captured by simulated surveillance system. Surveillance counts per day centered in each zip code location are shown as histograms within each zip code. Detection of an inserted test outbreak (red triangle) is indicated by red-bordered zip codes and a false-positive outbreak by black-bordered zip codes. A, Pseudo-ROC curves of outbreak detection. Proportion detected for each surveillance system versus proportion of all false-positives identified. B, Proportion detected versus mean days to detection across decision thresholds.

