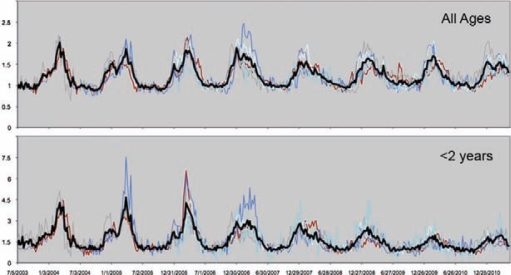
Fig. 1.
Distribute jurisdiction AGE trends, July 2003 to May 2011, shown normalized as a measure of relative increase for 6 jurisdictions (thin lines) and as a composite mean ratio (thick black lines). The top graph shows relative increase for ED visits among all age groups. The bottom shows relative increase only for those aged younger than 2 years.

