
Figure 5. Slow IPSCs show prolonged residual calcium-dependent facilitation.
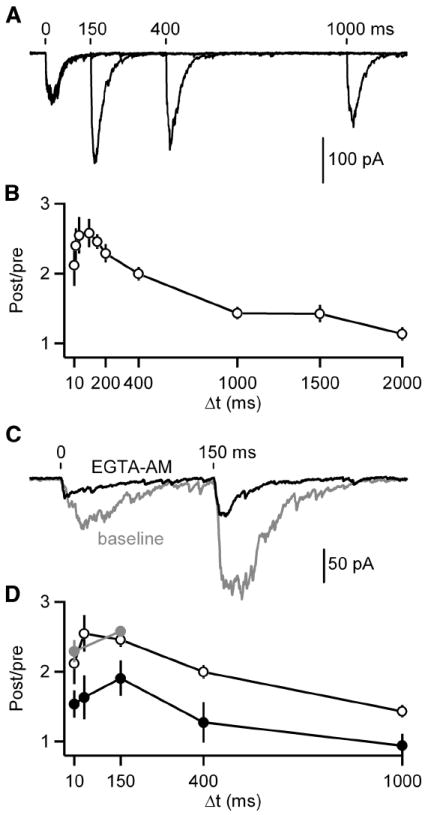
A-B, Pairs of IPSCs were evoked (Δt = 10, 20, 40, 100, 150, 200, 400, 1000, 1500 and 2000 ms). A, Representative averaged traces of paired pulses given with a Δt of 150, 400 and 1000 ms are shown. Tick marks indicate stimulation times. B, A summary plot of paired-pulse ratios (PPR) is provided (n = 5-10 cells per point). C-D, Baseline responses were recorded with a Δt of 10 and 150 ms before application of EGTA-AM (100 μM) after which responses were recorded with a Δt of 10, 40, 150, 400 and 1000 ms. C, Representative averaged traces are shown before (gray) and after (black) EGTA-AM application. Tick marks indicate stimulation times. D, A summary plot of PPRs in control (black open circles; data from B), baseline prior to EGTA-AM (gray) and EGTA-AM (black closed circles; n = 5 cells) conditions. Data are means ± SEM.