
Figure 6. Slow release of GABA results from presynaptic residual calcium signaling.
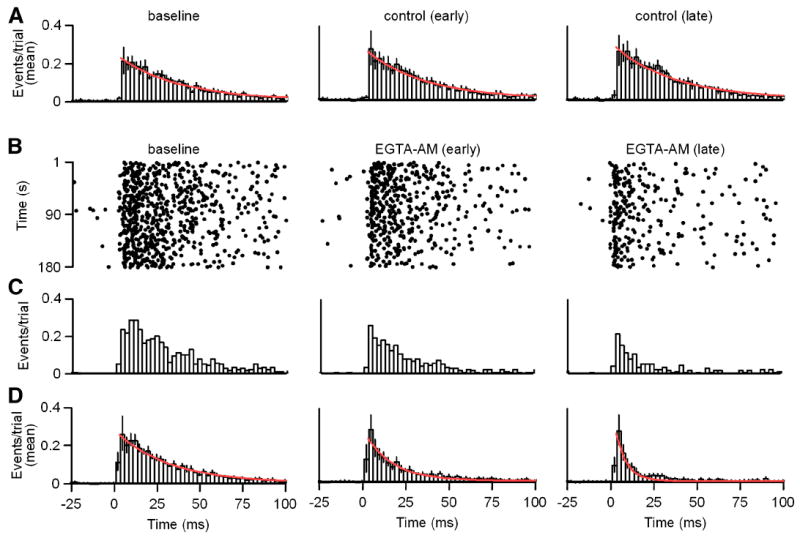
A-D Unitary IPSCs were evoked in response to 1 Hz stimulus trains as in Figure 3. A, Histogram plots of mean event times per trial with exponential fits to the decay (red) are shown in control conditions from Δt = -3-0 minutes (left; τdecay = 35 ms), Δt = 1-4 minutes (middle; τdecay = 34 ms) and Δt = 5-8 minutes (right; τdecay = 35 ms). B-D, Recordings were preformed as in A with EGTA-AM (100 μM) application begun at Δt = 0 minutes. B, Raster plots of event times are shown for a representative example. C, Histogram plots of event times per trial for the data shown in B are provided. D, Histogram plots of mean event times per trial with exponential fits to the decay (red) are shown in baseline conditions from Δt = -3-0 minutes (left; τdecay = 31 ms), and at Δt = 1-4 minutes (middle; τdecay = 16 ms) and Δt = 5-8 minutes (right; τdecay = 6 ms) during EGTA-AM application begun at Δt = 0 minutes as in B-C. Histogram bin widths = 2.5 ms. Data are means ± SEM.