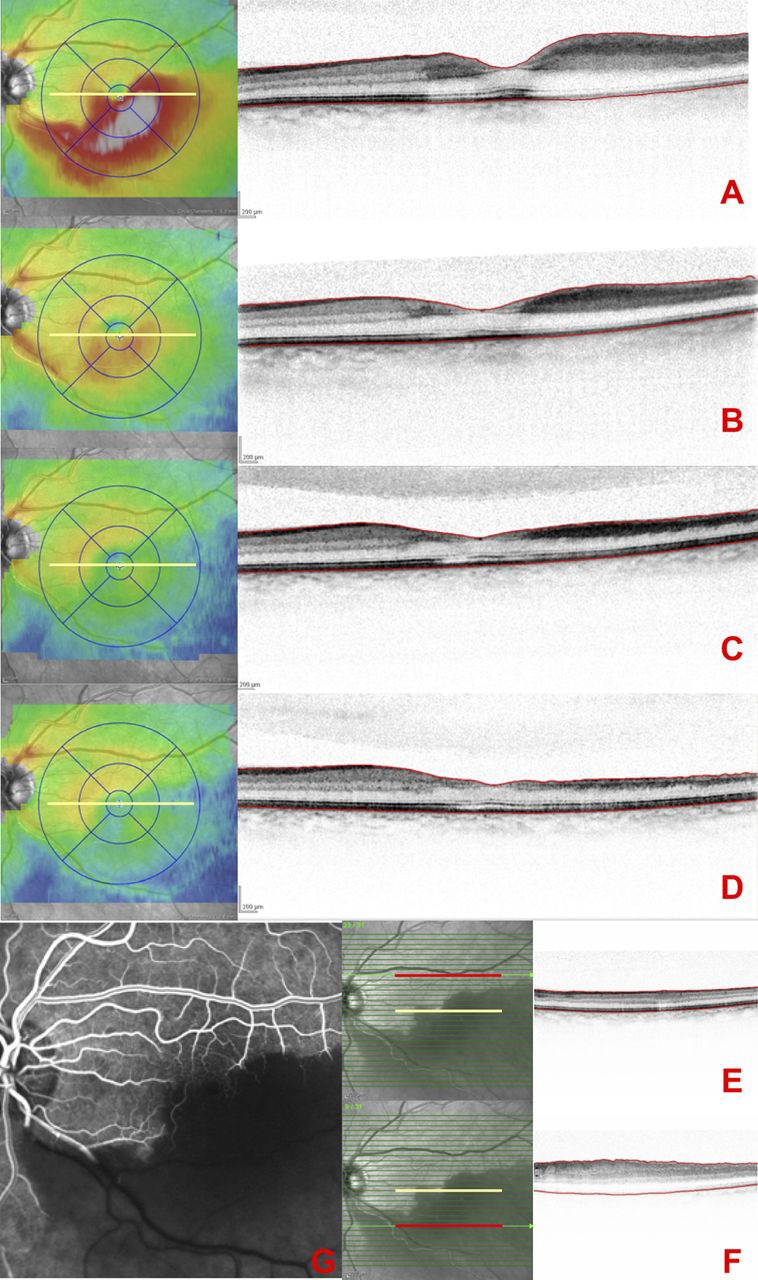
Figure 3.

(A–D) Occlusion of the infertior temporal artery in the left eye, showing an oedematous area along the inferior temporal branch and a partially compromised fovea. Serial spectral-domain OCT macular thickness maps and high resolution A scans across the fovea recorded at day 0 (A), month 1 (B), month 2 (C) and month 3 (D). The scans show an increase in retinal thickness in the inferior macula as a result of oedema in the inner retinal layers. The oedema subsequently resolved at month 1 (B) with decreasing macular thickness at month 2 (C). (E, F) Infrared fundus images with the superimposed OCT scan-lines and the selected B-scans for segmentation measurements at baseline. The central foveal scan is indicated by the yellow line, and the selected scans in the normal counterpart (E) and the affected region (F) are indicated with a red line. (G) Fluorescein angiography showing asymetry in vascular filling in the early phase of the examination.
